Electron tomography analysis of envelope glycoprotein trimers on HIV and simian immunodeficiency virus virions
- PMID: 14668432
- PMCID: PMC307650
- DOI: 10.1073/pnas.2634931100
Electron tomography analysis of envelope glycoprotein trimers on HIV and simian immunodeficiency virus virions
Abstract
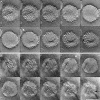
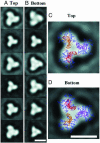
We used electron tomography to directly visualize trilobed presumptive envelope (env) glycoprotein structures on the surface of negatively stained HIV type 1 (HIV-1) and simian immunodeficiency virus (SIV) virions. Wild-type HIV-1 and SIV virions had an average of 8-10 trimers per virion, consistent with predictions based on biochemical evidence. Mutant SIVs, biochemically demonstrated to contain high levels of the viral env proteins, averaged 70-79 trimers per virion in tomograms. These correlations strongly indicate that the visualized trimers represent env spikes. The env trimers were without obvious geometric distribution pattern or preferred rotational orientation. Combined with biochemical analysis of gag/env ratios in virions, these trimer counts allow calculation of the number of gag molecules per virion, yielding an average value of approximately 1400. Virion and env dimensions were also determined. Image-averaging analysis of SIV env trimers revealed a distinct chirality and strong concordance with recent molecular models. The results directly demonstrate the presence of env trimers on the surface of AIDS virus virions, albeit at numbers much lower than generally appreciated, and have important implications for understanding virion formation, virus interactions with host cells, and virus neutralization.
Figures


Similar articles
-
Envelope glycoprotein incorporation, not shedding of surface envelope glycoprotein (gp120/SU), Is the primary determinant of SU content of purified human immunodeficiency virus type 1 and simian immunodeficiency virus.J Virol. 2002 Jun;76(11):5315-25. doi: 10.1128/jvi.76.11.5315-5325.2002. J Virol. 2002. PMID: 11991960 Free PMC article.
-
Immunization with wild-type or CD4-binding-defective HIV-1 Env trimers reduces viremia equivalently following heterologous challenge with simian-human immunodeficiency virus.J Virol. 2010 Sep;84(18):9086-95. doi: 10.1128/JVI.01015-10. Epub 2010 Jul 7. J Virol. 2010. PMID: 20610729 Free PMC article.
-
Dual Pathways of Human Immunodeficiency Virus Type 1 Envelope Glycoprotein Trafficking Modulate the Selective Exclusion of Uncleaved Oligomers from Virions.J Virol. 2021 Jan 13;95(3):e01369-20. doi: 10.1128/JVI.01369-20. Print 2021 Jan 13. J Virol. 2021. PMID: 33148792 Free PMC article.
-
Distribution and three-dimensional structure of AIDS virus envelope spikes.Nature. 2006 Jun 15;441(7095):847-52. doi: 10.1038/nature04817. Epub 2006 May 24. Nature. 2006. PMID: 16728975
-
Understanding the process of envelope glycoprotein incorporation into virions in simian and feline immunodeficiency viruses.Viruses. 2014 Jan 16;6(1):264-83. doi: 10.3390/v6010264. Viruses. 2014. PMID: 24441862 Free PMC article. Review.
Cited by
-
Antiretroviral Therapy with Ritonavir-Boosted Atazanavir- and Lopinavir-Containing Regimens Correlates with Diminished HIV-1 Neutralization.Vaccines (Basel). 2024 Oct 17;12(10):1176. doi: 10.3390/vaccines12101176. Vaccines (Basel). 2024. PMID: 39460342 Free PMC article.
-
Signal peptide exchange alters HIV-1 envelope antigenicity and immunogenicity.Front Immunol. 2024 Sep 24;15:1476924. doi: 10.3389/fimmu.2024.1476924. eCollection 2024. Front Immunol. 2024. PMID: 39380992 Free PMC article.
-
Exploring HIV-1 Maturation: A New Frontier in Antiviral Development.Viruses. 2024 Sep 6;16(9):1423. doi: 10.3390/v16091423. Viruses. 2024. PMID: 39339899 Free PMC article. Review.
-
The HIV-1 capsid serves as a nanoscale reaction vessel for reverse transcription.PLoS Pathog. 2024 Sep 3;20(9):e1011810. doi: 10.1371/journal.ppat.1011810. eCollection 2024 Sep. PLoS Pathog. 2024. PMID: 39226318 Free PMC article.
-
Probing Gag-Env dynamics at HIV-1 assembly sites using live-cell microscopy.J Virol. 2024 Sep 17;98(9):e0064924. doi: 10.1128/jvi.00649-24. Epub 2024 Aug 13. J Virol. 2024. PMID: 39136462 Free PMC article.
References
-
- Blacklow, S. C., Lu, M. & Kim, P. S. (1995) Biochemistry 34, 14955-14962. - PubMed
-
- Lu, M., Blacklow, S. C. & Kim, P. S. (1995) Nat. Struct. Biol. 2, 1075-1082. - PubMed
-
- Wyatt, R., Kwong, P. D., Desjardins, E., Sweet, R. W., Robinson, J., Hendrickson, W. A. & Sodroski, J. G. (1998) Nature 393, 705-711. - PubMed
-
- Wyatt, R. & Sodroski, J. G. (1998) Science 280, 1884-1888. - PubMed
Publication types
MeSH terms
Substances
Grants and funding
LinkOut - more resources
Full Text Sources
Other Literature Sources
Molecular Biology Databases

