. 2003 Dec 15;22(24):6631-41.
doi: 10.1093/emboj/cdg633.

Visualizing telomere dynamics in living mammalian cells using PNA probes

Affiliations

Visualizing telomere dynamics in living mammalian cells using PNA probes

Chris Molenaar et al. EMBO J. .

Abstract

Chromosome ends are protected from degradation by the presence of the highly repetitive hexanucleotide sequence of TTAGGG and associated proteins. These so-called telomeric complexes are suggested to play an important role in establishing a functional nuclear chromatin organization. Using peptide nucleic acid (PNA) probes, we studied the dynamic behavior of telomeric DNA repeats in living human osteosarcoma U2OS cells. A fluorescent cy3-labeled PNA probe was introduced in living cells by glass bead loading and was shown to specifically associate with telomeric DNA shortly afterwards. Telomere dynamics were imaged for several hours using digital fluorescence microscopy. While the majority of telomeres revealed constrained diffusive movement, individual telomeres in a human cell nucleus showed significant directional movements. Also, a subfraction of telomeres were shown to associate and dissociate, suggesting that in vivo telomere clusters are not stable but dynamic structures. Furthermore, telomeres were shown to associate with promyelocytic leukemia (PML) bodies in a dynamic manner.


Figures
None
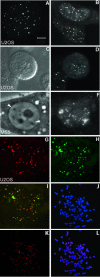
Fig. 1. Telomere-specific PNA probe binds to telomeric DNA sequences. Human U2OS as well as mouse MS5 cells were bead-loaded with a cy3-labeled (C3TA2)3 PNA probe and monitored 2 h later. Binding of the probe to telomeric DNA in U2OS cells resulted in variable numbers of fluorescent spots that varied in size and intensity (A and B). The image of the cell depicted in (A) reveals 54 spots, while in the two cells shown in (B), 51 and 65 spots are visible. In addition to interphase cells, binding of PNA probe to telomeres in mitotic cells was also observed as indicated by the differential interference contrast image (C) and the fluorescence image (D). In mouse MS5 cells, telomeres localized to two heterochromatic regions, which are indicated by arrows in the phase contrast image (E) in addition to other nuclear sites (F). Living U2OS cells that were first loaded with lissamine- labeled PNA probe (G), and then fixed and hybridized with a FITC- labeled, telomere-specific plasmid probe (H), show colocalization as indicated in yellow in (I). Hybridization of cy3-labeled (C3TA2)3 PNA probe to metaphase spreads of U2OS cells revealed staining of telomeric DNA at nearly all chromosome ends, in addition to staining of a few extrachromosomal telomeric DNA repeats (K and L). Chromosomes were counterstained with DAPI (J). Bar = 5 µm.
None
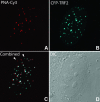
Fig. 2. Hybridization of PNAs to telomeric DNA does not prevent binding of CFP–TRF2 in living U2OS cells. Double labeling of cells with CFP–TRF2 and cy3-PNA results in a nearly complete colocalization of the two (C). Hybridization of cy3-PNA to telomeres is shown in (A) and recruitment of CFP–TRF2 to telomeres is shown in (B). (C) A few telomeres, indicated with arrowheads, were stained with either PNA probe or CFP–TRF2 only. A differential interference contrast image of this nucleus is shown in (D).
None
Fig. 3. Live-cell imaging demonstrates dynamics of telomeric DNA. U2OS cells were loaded with cy3-labeled (C3TA2)3 PNA and image stacks were collected every 90 s for 60 min. During two different time periods, the movements of telomeres [indicated by arrows and arrowheads in (A)] were recorded and the trajectories were plotted (B and C). As indicated by the length of the trajectories, some telomeres showed a significant movement while others showed hardly any movement. (D) Another example of a cell nucleus in which a telomere spot (arrowhead) moved over a large distance within a defined (6 min) time period. From the cell in (A)–(C), the trajectories of a selected number of telomeres in the first 20 min of the time-lapse series are calculated and displayed in the xy-plane (E). While most telomeres moved in a small area, the spot indicated by trajectory number 13 showed significant movement. This difference in mobility becomes more apparent when the trajectories (F) and velocities (G) of spots 10 (green) and 13 (purple) are compared. In (F), the trajectory of the two telomeres is shown from two different viewpoints.
None
Fig. 4. Quantitative analysis of telomere movements. (A) A plot of MSD against Δt for telomeres stained with either cy3-PNA or CFP–TRF2. Data represent average values of 100 telomeres (derived from five cells) for cy3-PNA and 25 telomeres for CFP–TRF2 (derived from two cells). Both plots show an indicative for constraint diffusion and reach a plateau at ∼0.2 µm2/s. (B) MSD plot of three populations of cy3-PNA labeled telomeres demonstrating different movement behavior. The squares represent the most constrained population, which is also shown in (A). The triangles represent a subpopulation of telomeres (10% of all telomeres) that show faster movement over larger distances but that still reach a plateau. The diamonds represent a fast-moving telomere. By plotting MSD/Δt, proportional to the diffusion coefficent, as a function of Δt (Vazquez et al., 2001), it becomes clear that the diffusion coefficient decreases with increasing time intervals for the two slowest populations (C and D), consistent with constrained movement, but not for the fast telomere for the time period analyzed (D).
None
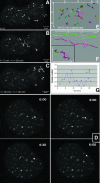
Fig. 5. Time-lapse microscopy demonstrates temporal interactions between telomeric DNA foci. U2OS cells were loaded with cy3-labeled (C3TA2)3 PNA and image stacks were recorded at 60-s time-intervals for 1 h. In the cell shown in (AH), two independent fusion events were recorded as indicated by arrowheads. In another interphase cell nucleus, the separation of two telomeric DNA foci is shown (JL, arrows). Images represent maximum projections of 16 Z-sections.
None
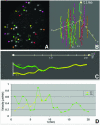
Fig. 6. Tracking of telomeric association in time and space. Twenty-one time-lapse images of the cell shown in Figure 4, including a telomere association event, were analyzed using an image tracking algorithm, and visualized graphically. The maximum projection of the first three-dimensional image stack in this time series is shown in (A). The time–space trajectories of telomeres are shown in (B). The colored trajectories in (B) correspond to the fluorescent spots indicated by colored arrowheads in (A). The association event was analyzed in more detail as shown in (C) and (D). From time point 10 min, both the movement and velocity of spots 21 and 23 are identical, indicating a stable association between two telomeres.
None
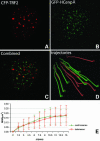
Fig. 7. Quantitative analysis of movement of telomeres and centromeres in a single nucleus. Telomeres and centromeres were visualized using CFP–TRF2 (A) and GFP–hCENPA (B), respectively. The overlay of these images is shown in (C). Quantitative movement analysis of telomeres and centromeres was performed using the TILLvisTRAC software as described in Materials and methods. A selection of trajectories is shown in (D). Average MSD values of both telomeres (n = 16) and centromeres (n = 16) in one nucleus plotted against Δt revealed that the average MSD of centromeres is similar to that of the population of constrained telomeres (E).
None
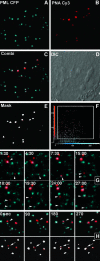
Fig. 8. Telomeric DNA associates with PML bodies in a dynamic manner. U2OS cells were transiently transfected with CFP–PML (A) and loaded with cy3-labeled (C3TA2)3 PNA (B). A subset of telomeres were shown to be associated with PML bodies (C). A differential contrast image of the cell in (A)–(C) is shown in (D). The colocalization of telomeric DNA with PML in this cell is more clearly shown in a mask image (E) that was obtained by selecting those pixels in which the intensity of both colors was above a threshold value that distinguished the specific signals from background fluorescence (F). Time-lapse images of another cell nucleus, taken every 90 s for 30 min, reveal successively the association of a telomere with a PML body, its dissociation from the body and its association with another PML body (G). Occasionally, PML protein was shown to localize to a telomeric DNA sequence before their association with a PML nuclear body (H). In the lower row, the colocalization between telomeric DNA and PML is shown in white by selecting pixels in which the intensity of both colors is above threshold value.
None
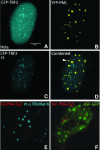
Fig. 9. Telomeres do not associate with PML bodies in telomerase-positive HeLa cells, nor with nucleoli, speckles and Cajal bodies in U2OS cells. Coexpression of CFP–TRF2 (A and C) and YFP–PML (B) revealed no association between telomeres and PML bodies (D). TRF2 showed a more diffuse nuclear staining and weaker telomeric signals in HeLa cells compared with U2OS cells (Figure 2). The arrow indicates an apparent colocalization between a telomere and a PML body, however the spots were derived from different Z-slices. (E and F) In U2OS cells, telomeres are not associated with nucleoli, Cajal bodies or speckles, as demonstrated after bead-loading of cells with a Cy3- labeled (C3TA2)3 PNA probe, in which either nucleoli and Cajal bodies were stained using an anti-fibrillarin antibody (E), or speckles by transfection with ASF–GFP (F).

Similar articles

Cited by

References

    1. Abney J.R., Cutler,B., Fillbach,M.L., Axelrod,D. and Scalettar,B.A. (1997) Chromatin dynamics in interphase nuclei and its implications for nuclear structure. J. Cell Biol., 137, 1459–1468. - PMC - PubMed
    1. Azzalin C.M., Nergadze,S.G. and Giulotto,E. (2001) Human interchromosomal telomeric-like repeats: sequence organization and mechanisms of origin. Chromosoma, 110, 75–82. - PubMed
    1. Baur J.A., Zou,Y., Shay,J.W. and Wright,W.E. (2001) Telomere position effect in human cells. Science, 292, 2075–2077. - PubMed
    1. Bornfleth H., Edelmann,P., Zink,D., Cremer,T. and Cremer,C. (1999) Quantitative motion analysis of subchromosomal foci in living cells using four-dimensional microscopy. Biophys. J., 77, 2871–2886. - PMC - PubMed
    1. Brown K.E., Baxter,J., Graf,D., Merkenschlager,M. and Fisher,A.G. (1999) Dynamic repositioning of genes in the nucleus of lymphocytes preparing for cell division. Mol. Cell, 3, 207–217. - PubMed

Publication types

Substances