

Interactions of inertial cavitation bubbles with stratum corneum lipid bilayers during low-frequency sonophoresis
- PMID: 14645045
- PMCID: PMC1303657
- DOI: 10.1016/S0006-3495(03)74770-5
Interactions of inertial cavitation bubbles with stratum corneum lipid bilayers during low-frequency sonophoresis
Abstract
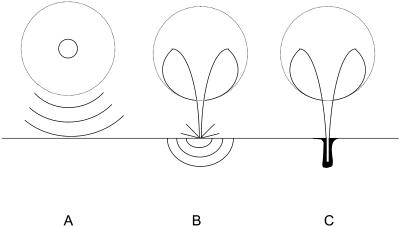
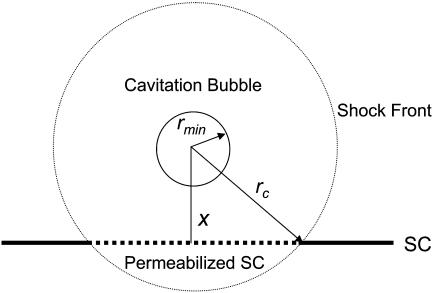
Interactions of acoustic cavitation bubbles with biological tissues play an important role in biomedical applications of ultrasound. Acoustic cavitation plays a particularly important role in enhancing transdermal transport of macromolecules, thereby offering a noninvasive mode of drug delivery (sonophoresis). Ultrasound-enhanced transdermal transport is mediated by inertial cavitation, where collapses of cavitation bubbles microscopically disrupt the lipid bilayers of the stratum corneum. In this study, we describe a theoretical analysis of the interactions of cavitation bubbles with the stratum corneum lipid bilayers. Three modes of bubble-stratum corneum interactions including shock wave emission, microjet penetration into the stratum corneum, and impact of microjet on the stratum corneum are considered. By relating the mechanical effects of these events on the stratum corneum structure, the relationship between the number of cavitation events and collapse pressures with experimentally measured increase in skin permeability was established. Theoretical predictions were compared to experimentally measured parameters of cavitation events.
Figures
Similar articles
-
Bubble growth within the skin by rectified diffusion might play a significant role in sonophoresis.J Control Release. 2007 Feb 12;117(2):246-55. doi: 10.1016/j.jconrel.2006.10.027. Epub 2006 Nov 6. J Control Release. 2007. PMID: 17197050
-
A mechanistic study of ultrasonically-enhanced transdermal drug delivery.J Pharm Sci. 1995 Jun;84(6):697-706. doi: 10.1002/jps.2600840607. J Pharm Sci. 1995. PMID: 7562407
-
Transdermal drug delivery using ultrasound-theory, understanding and critical analysis.Cell Mol Biol (Noisy-le-grand). 2005 Sep 2;51 Suppl:OL767-84. Cell Mol Biol (Noisy-le-grand). 2005. PMID: 16171576 Review.
-
The importance of microjet vs shock wave formation in sonophoresis.J Control Release. 2010 Dec 1;148(2):204-11. doi: 10.1016/j.jconrel.2010.07.106. Epub 2010 Jul 22. J Control Release. 2010. PMID: 20655341
-
Recent progress in transdermal sonophoresis.Pharm Dev Technol. 2017 Jun;22(4):458-466. doi: 10.3109/10837450.2015.1116566. Epub 2015 Nov 25. Pharm Dev Technol. 2017. PMID: 26608060 Review.
Cited by
-
Delivery systems for intradermal vaccination.Curr Top Microbiol Immunol. 2012;351:77-112. doi: 10.1007/82_2011_123. Curr Top Microbiol Immunol. 2012. PMID: 21472533 Free PMC article. Review.
-
Stability of Engineered Micro or Nanobubbles for Biomedical Applications.Pharmaceutics. 2020 Nov 13;12(11):1089. doi: 10.3390/pharmaceutics12111089. Pharmaceutics. 2020. PMID: 33202709 Free PMC article. Review.
-
Ultrasound-enhanced delivery of antibiotics and anti-inflammatory drugs into the eye.Ultrasound Med Biol. 2013 Apr;39(4):638-46. doi: 10.1016/j.ultrasmedbio.2012.11.010. Epub 2013 Feb 13. Ultrasound Med Biol. 2013. PMID: 23415283 Free PMC article.
-
Sonosensitive Cavitation Nuclei-A Customisable Platform Technology for Enhanced Therapeutic Delivery.Molecules. 2023 Nov 23;28(23):7733. doi: 10.3390/molecules28237733. Molecules. 2023. PMID: 38067464 Free PMC article. Review.
-
Passive imaging with pulsed ultrasound insonations.J Acoust Soc Am. 2012 Jul;132(1):544-53. doi: 10.1121/1.4728230. J Acoust Soc Am. 2012. PMID: 22779500 Free PMC article.
References
-
- Alexandrov, A. V. 2002. Ultrasound-enhanced thrombolysis for stroke: clinical significance. Eur. J. Ultrasound. 16:131–140. - PubMed
-
- Anderson, R. L., and J. M. Cassidy. 1973. Variations in physical dimensions and chemical composition of human stratum corneum. J. Invest. Dermatol. 61:30–32. - PubMed
-
- Barber, B. P., K. R. Wenninger, and S. J. Puttermann. 1997. Sonoluminescence. Phil. Trans. R. Soc. London. 355:641–648.
-
- Baumann, M., and R. Gerebe. 1998. Characteristics of the osmotically induced membrane rupture. Mol. Membr. Biol. 15:193–201. - PubMed
-
- Black, G. 1993. Interaction between anionic surfactants and skin. In Pharmaceutical Skin Penetration Enhancement. J. Hadgraft, editor. Marcel Dekker, New York, Basel, and Hong Kong. 145–174.
Publication types
MeSH terms
Substances
LinkOut - more resources
Full Text Sources
Other Literature Sources
