

The genome sequence of Caenorhabditis briggsae: a platform for comparative genomics
- PMID: 14624247
- PMCID: PMC261899
- DOI: 10.1371/journal.pbio.0000045
The genome sequence of Caenorhabditis briggsae: a platform for comparative genomics
Abstract
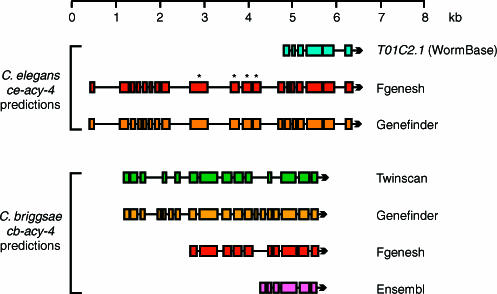
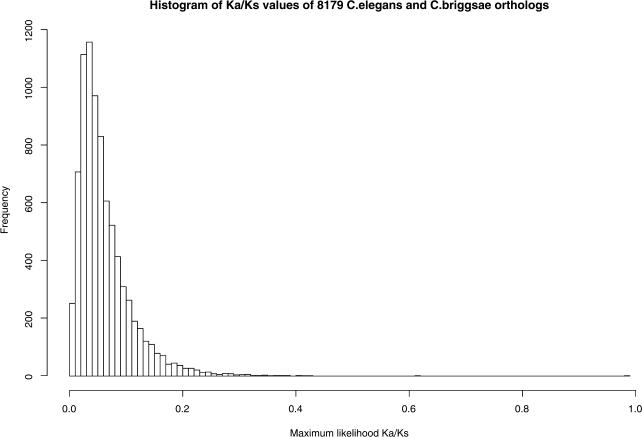
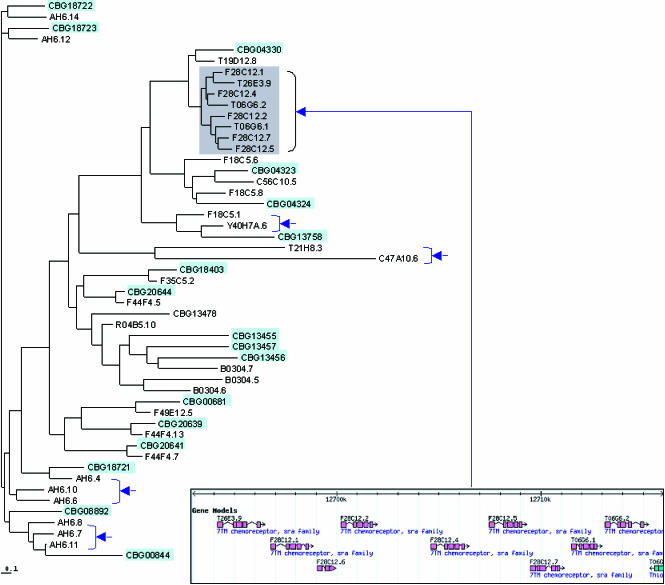
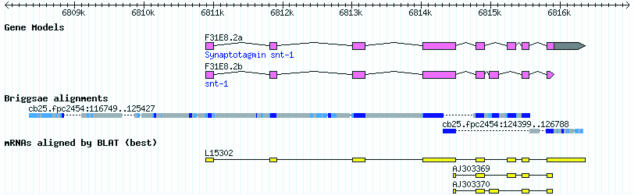
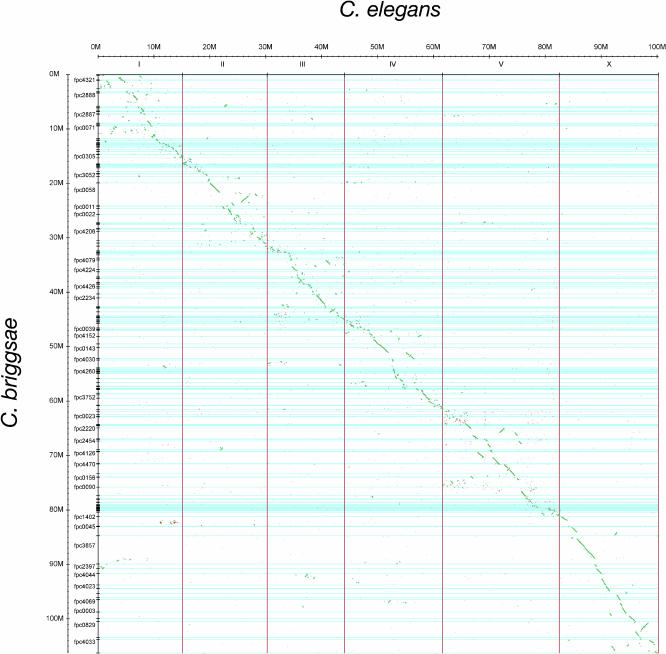
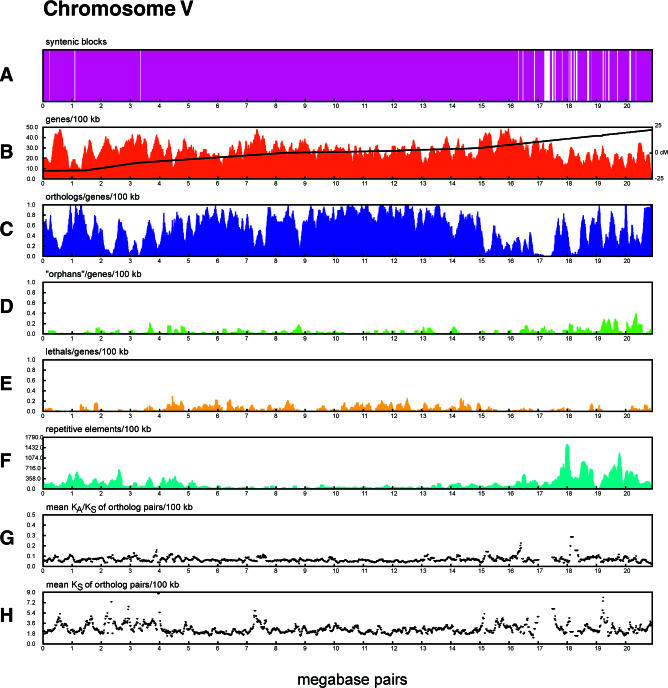
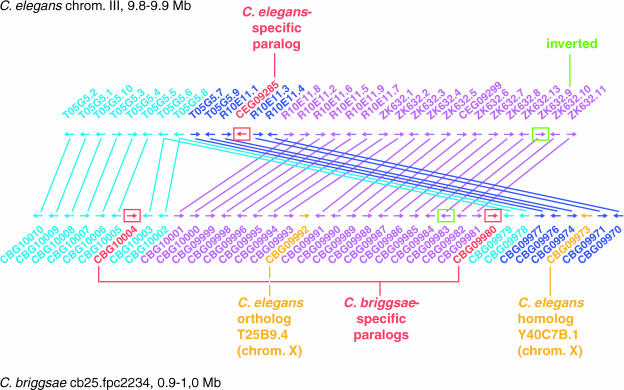
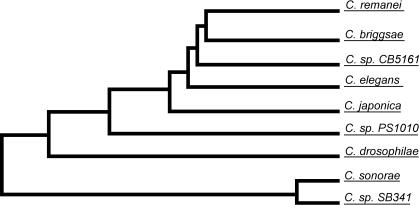
The soil nematodes Caenorhabditis briggsae and Caenorhabditis elegans diverged from a common ancestor roughly 100 million years ago and yet are almost indistinguishable by eye. They have the same chromosome number and genome sizes, and they occupy the same ecological niche. To explore the basis for this striking conservation of structure and function, we have sequenced the C. briggsae genome to a high-quality draft stage and compared it to the finished C. elegans sequence. We predict approximately 19,500 protein-coding genes in the C. briggsae genome, roughly the same as in C. elegans. Of these, 12,200 have clear C. elegans orthologs, a further 6,500 have one or more clearly detectable C. elegans homologs, and approximately 800 C. briggsae genes have no detectable matches in C. elegans. Almost all of the noncoding RNAs (ncRNAs) known are shared between the two species. The two genomes exhibit extensive colinearity, and the rate of divergence appears to be higher in the chromosomal arms than in the centers. Operons, a distinctive feature of C. elegans, are highly conserved in C. briggsae, with the arrangement of genes being preserved in 96% of cases. The difference in size between the C. briggsae (estimated at approximately 104 Mbp) and C. elegans (100.3 Mbp) genomes is almost entirely due to repetitive sequence, which accounts for 22.4% of the C. briggsae genome in contrast to 16.5% of the C. elegans genome. Few, if any, repeat families are shared, suggesting that most were acquired after the two species diverged or are undergoing rapid evolution. Coclustering the C. elegans and C. briggsae proteins reveals 2,169 protein families of two or more members. Most of these are shared between the two species, but some appear to be expanding or contracting, and there seem to be as many as several hundred novel C. briggsae gene families. The C. briggsae draft sequence will greatly improve the annotation of the C. elegans genome. Based on similarity to C. briggsae, we found strong evidence for 1,300 new C. elegans genes. In addition, comparisons of the two genomes will help to understand the evolutionary forces that mold nematode genomes.
Conflict of interest statement
The authors have declared that no conflicts of interest exist.
Figures
Similar articles
-
The gut esterase gene (ges-1) from the nematodes Caenorhabditis elegans and Caenorhabditis briggsae.J Mol Biol. 1993 Feb 20;229(4):890-908. doi: 10.1006/jmbi.1993.1094. J Mol Biol. 1993. PMID: 8445654
-
Genome annotation of Caenorhabditis briggsae by TEC-RED identifies new exons, paralogs, and conserved and novel operons.G3 (Bethesda). 2022 Jul 6;12(7):jkac101. doi: 10.1093/g3journal/jkac101. G3 (Bethesda). 2022. PMID: 35485953 Free PMC article.
-
Comparison of C. elegans and C. briggsae genome sequences reveals extensive conservation of chromosome organization and synteny.PLoS Biol. 2007 Jul;5(7):e167. doi: 10.1371/journal.pbio.0050167. Epub 2007 Jul 3. PLoS Biol. 2007. PMID: 17608563 Free PMC article.
-
Comparative genomics in C. elegans, C. briggsae, and other Caenorhabditis species.Methods Mol Biol. 2006;351:13-29. doi: 10.1385/1-59745-151-7:13. Methods Mol Biol. 2006. PMID: 16988423 Review.
-
The draft genome sequence of the nematode Caenorhabditis briggsae, a companion to C. elegans.Genome Biol. 2003;4(12):238. doi: 10.1186/gb-2003-4-12-238. Epub 2003 Nov 18. Genome Biol. 2003. PMID: 14659008 Free PMC article. Review.
Cited by
-
Extensive conservation of ancient microsynteny across metazoans due to cis-regulatory constraints.Genome Res. 2012 Dec;22(12):2356-67. doi: 10.1101/gr.139725.112. Epub 2012 Jun 21. Genome Res. 2012. PMID: 22722344 Free PMC article.
-
Reproductive Mode and the Evolution of Genome Size and Structure in Caenorhabditis Nematodes.PLoS Genet. 2015 Jun 26;11(6):e1005323. doi: 10.1371/journal.pgen.1005323. eCollection 2015 Jun. PLoS Genet. 2015. PMID: 26114425 Free PMC article.
-
Evolutionary patterns of RNA-based gene duplicates in Caenorhabditis nematodes coincide with their genomic features.BMC Res Notes. 2012 Aug 1;5:398. doi: 10.1186/1756-0500-5-398. BMC Res Notes. 2012. PMID: 22853807 Free PMC article.
-
Global analysis of neuropeptide receptor conservation across phylum Nematoda.BMC Biol. 2024 Oct 8;22(1):223. doi: 10.1186/s12915-024-02017-6. BMC Biol. 2024. PMID: 39379997 Free PMC article.
-
A dominant dpy-10 co-transformation marker using CRISPR/Cas9 and a linear repair template in Caenorhabditis tropicalis.MicroPubl Biol. 2023 Nov 3;2023:10.17912/micropub.biology.000900. doi: 10.17912/micropub.biology.000900. eCollection 2023. MicroPubl Biol. 2023. PMID: 38021174 Free PMC article.
References
-
- Aguinaldo AM, Turbeville JM, Linford LS, Rivera MC, Garey JR, et al. Evidence for a clade of nematodes, arthropods, and other moulting animals. Nature. 1997;387:489–493. - PubMed
-
- Ambros V, Lee RC, Lavanway A, Williams PT, Jewell D. MicroRNAs and other tiny endogenous RNAs in C. elegans. Curr Biol. 2003;13:807–818. - PubMed
Publication types
MeSH terms
Substances
Grants and funding
LinkOut - more resources
Full Text Sources
Other Literature Sources
Molecular Biology Databases
Miscellaneous
