. 2003 Dec;23(23):8429-39.
doi: 10.1128/MCB.23.23.8429-8439.2003.

GATA-4 and GATA-5 transcription factor genes and potential downstream antitumor target genes are epigenetically silenced in colorectal and gastric cancer

Affiliations

GATA-4 and GATA-5 transcription factor genes and potential downstream antitumor target genes are epigenetically silenced in colorectal and gastric cancer

Yoshimitsu Akiyama et al. Mol Cell Biol. 2003 Dec.

Abstract

The GATA family of transcription factors participates in gastrointestinal (GI) development. Increases in GATA-4 and -5 expression occur in differentiation and GATA-6 expression in proliferation in embryonic and adult settings. We now show that in colorectal cancer (CRC) and gastric cancer promoter hypermethylation and transcriptional silencing are frequent for GATA-4 and -5 but are never seen for GATA-6. Potential antitumor target genes upregulated by GATA-4 and -5, the trefoil factors, inhibinalpha, and disabled-2 (Dab2) are also silenced, in GI cancers, with associated methylation of the promoters. Drug or genetically induced demethylation simultaneously leads to expression, in CRC cells, of all of the GATA-4, -5, and downstream genes. Expression of exogenous GATA-5 overrides methylation at the downstream promoters to activate the target genes. Selection for silencing of both upstream transcription factors and their target genes in GI cancers could indicate that epigenetic silencing of the involved genes provides a summated contribution to tumor progression.


Figures
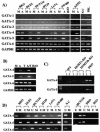
FIG. 1.
FIG. 1.
GATA-4, -5, and -6 expression in GI cancer cell lines. (A) GATA-4, -5, and -6 expression levels were examined by RT-PCR in seven cancer cell lines (CRC lines RKO, DLD1, HCT116, HT29, LoVo, and SW480 and GC cell line AZ521) with (lanes A) and without (lanes M [mock]) treatment with DAC and in normal colonic mucosa (lane NC) and peripheral blood lymphocytes (lane PBL). GAPDH expression is used as an internal loading control for the RT-PCR, and H2O indicates no RNA added. (B) GC cell line AZ521 was treated with low-dose DAC alone (lane A), TSA (lane T), a combination of these two drugs (lane A/T), or mock treatment (lane M), and examined by RT-PCR as described in panel A. (C) GATA-4 and GATA-5 expression was examined as described in panel A in wild-type (WT) HCT116 colon cancer cells and two clones each of these cells in which both alleles of DNA methyltransferases 1 (DNMT1-KO) and 3b (DNMT3b-KO) or both DNA methyltransferases (DKO) were knocked out (21). (D) MSP analysis of the promoter CpG islands of GATA-4 and -5 (primer regions depicted by black arrows [MSP] with an asterisk in Fig. 2) in six CRC lines and normal colon mucosa. PCR products recognizing unmethylated (lanes U) and methylated (lanes M) CpG sites are analyzed in 2.5% agarose gels stained by ethidium bromide. To the right, this MSP analysis is shown for GATA-4 and -5 in the HCT116 colon cancer wild-type and the DNMT1 plus DNMT3b knockout cells (DKO) used in panel C.
FIG. 2.
FIG. 2.
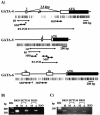
Schematic representation of 5′ regions of GATA-4, -5, and -6 and MSP analyses of promoter methylation status. (A) Schematic representation of the genes. The GATA-4 diagram includes a new exon 1, located 3.5 kb upstream of the previously designated exon 1 (identified from EST BG718444), genomic sequences containing this EST (AC090790 and AC069185), and a confirmatory PCR approach showing the EST to be contained in the single transcript amplified for this gene (see panel B). The newly reported GATA5 cDNA (no. NM080473) includes one 5′-untranslated exon (41 bp). This newly identified exon 1 is located 387 bp upstream of exon 2 that contains the translation start site in the genomic GATA-5 sequence (no. AL499627). The data for the genomic structure of GATA-6 (A and B) was obtained from the newly reported sequence of this gene (GenBank no. AC009669), which reveals two 5′-untranslated exons (1a and 1b). Boxes indicate exons, including coding (black) and noncording (white) regions. Vertical bars show CpG sites. Black arrows below the CpG sites indicate the regions analyzed by MSP, genomic sequencing (GS), and bisulfite sequencing (BS) in the present study. The regions analyzed by MSP for which methylation status corresponded to GATA-4, -5, and -6 expression are indicated by an asterisk. (B) RT-PCR analysis of 5′-untranslated region of GATA-4 by using the primer set (see panel A, RT-PCR) in CRC lines. (C) RT-PCR analysis of 5′-untranslated region of GATA5 with the primers designated as in panel A. Lanes (B and C): MK, 50-bp ladder marker; M, mock treatment of cells; A, treatment with DAC; H2O, no RNA added.
FIG. 3.
FIG. 3.
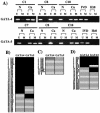
Methylation analysis of GATA-4 and -5 in noncultured normal and neoplastic GI samples. (A) Examples of MSP analyses (carried out as described for Fig. 1D) of GATA-4 and -5 in noncultured colon cancer tissues (Ca) and corresponding normal mucosae (N). Lanes: U, unmethylated alleles; M, methylated alleles; IVD, in vitro-methylated control; H2O, no DNA added. (B) Summary of the analyses for GATA-4 and -5 methylation in 45 primary CRCs. Each number in the vertical column represents a single tumor. Key: black, detection of methylated alleles; white, detection of unmethylated alleles only. (C) MSP analyses for normal colon mucosa samples from patients without (n = 2) or with (n = 12) cancer. Shaded boxes indicate weak detection of methylated alleles in two patients with GATA-4 simultaneously hypermethylated in cancer. (D) Summary for 27 primary GCs.
FIG. 4.
FIG. 4.
Sodium bisulfite DNA sequencing of GATA-4 and -5 in colorectal (RKO and HCT116) and gastric (NuGC2) cancer cell lines and in various noncultured GI tissue samples. Each horizontal row of squares represents analysis, in a single clone of bisulfite-treated DNA, of 36 (GATA-4) or 42 (GATA-5) CpG sites contained in the region shown. Solid and open squares represent methylated and unmethylated CpG sites, respectively. GATA expression-negative cell lines (GATA-4 in HCT116 and GATA-5 in RKO) show densely methylated clones, but expression-positive cells (GATA-4 in RKO and GATA-5 in NuGC2 GC cells) have predominantly unmethylated clones. A primary colon cancer (case C10C) has predominantly methylated clones of GATA-4 and -5, and normal colon mucosa from the same patient (C10N) has unmethylated clones.
FIG. 5.
FIG. 5.
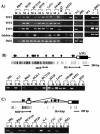
Expression and methylation status of GATA downstream target genes in cultured colon cancer and GC cells and normal tissues. (A) RT-PCR analyses of the expression of each gene in the same colon cancer and GC cell lines and normal tissues as given for GATA analyses in Fig. 1A. Also, to the far right, is shown an analysis of expression, carried out as described above, of the TFF genes and inhibinα in the HCT116 colon cancer wild-type (WT) and DNMT1−/− plus DNMT3b−/− cells (DKO) shown in Fig. 1C. Lanes: M, mock treatment of cells; A, treatment with DAC; NC, normal colon; PBL, normal lymphocytes; H2O, no RNA added. (B) Methylation status of the inhibinα gene. A schematic of the 5′ region of the gene is shown above in which the rectangle depicts the first exon, and the blackened area denotes the coding region within this exon. The black triangles represent positions of consensus GATA-binding sites, and the vertical lines each represent a CpG site. The large arrow (BS) denotes a region of bisulfite sequencing for the CpG poor region previously thought to be the only promoter region (see the text), and the smaller arrows (MSP) represent the positions of primers used for the MSP analysis in all of the cancer cell lines of the newly defined CpG island discussed in the text and shown in the lower part of panel B. Lanes: U, unmethylated alleles; M, methylated alleles; PBL, normal lymphocytes; NC, normal colon; H2O, no DNA added. (C) Methylation status of Dab2. A schematic of Dab2 is shown above in which a 5′ untranslated exon 1 (open box) is located upstream from exon 2 which contains the ATG for start of the coding region (black area within the square for exon 2). Arching line, mRNA splicing which joins exon 1 to exon 2; black triangles, positions of GATA-binding sites; vertical lines, CpG sites and the island around exon 1; arrows at the bottom (MSP), position of MSP primers used to analyze the methylation status of the CpG island as shown in the panel below. The lower part of panel C shows examples of MSP results for the methylation status of the Dab2 5′ CpG island. Lanes: U, unmethylated alleles; M, methylated alleles; PBL, normal lymphocytes; NC, normal colon; C1C and C2C, colon cancers.
FIG. 6.
FIG. 6.
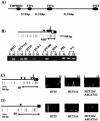
Methylation status of TFF1 to TFF3 in cultured colon cancer cells. (A) Schematic of the alignment of the three TFF genes on chromosome 21q22.3. The location of a separate gene, TMPRSS3, upstream from TFF1 is also shown. No CpG islands could be located anywhere along the depicted stretch of genomic sequence. (B) Methylation status of TFF1. A schematic of the 5′ region of the gene depicts the transcription start site (large vertical arrow) and exon 1 is shown in the rectangle, with the coding region portion shown in solid black. Vertical black triangles, GATA binding sites; vertical lines, CpG sites. Horizontal arrows (MSP) show the primer sites for the MSP analysis in the panel below for selected cancer cell lines and normal tissues (NC, normal colon; PBL, peripheral blood lymphocytes). (C) Schematic of the 5′ region of TFF2. All symbols are exactly as for those in Fig. 6A except that the horizontal arrow (BS) show the area represented in the bisulfite sequencing shown directly beside the schematic. For the sequencing all horizontal squares represent CpG sites in individual sequenced clones (white, unmethylated; black, methylated). The sequencing is shown for (i) HT29 cells in which the gene is expressed, (ii) HCT116 cells in which it is not, and (iii) these same cells which express the gene after adenoviral expression of GATA-5 (see Fig. 7). (D) Schematic of the 5′ region of TFF3. All symbols are as described for the other panels and, again, the horizontal arrow (BS) shows the area represented in the bisulfite sequencing shown directly beside the schematic.
FIG. 7.
FIG. 7.
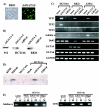
Overexpression of GATA-5 in GI cancer cells. (A) Morphological analysis in RKO cells after a GATA-5 construct was overexpressed by using an adenovirus system (20). The left subpanel shows the phase-contrast morphological appearance, and right subpanel shows green fluorescent protein expression in the same fields. (B) Immunoblotting with anti-GATA-5 antibody in cancer cells. The 911 cell line (16) used to package the viral construct served as a positive control for production of the protein. GATA-5 protein is basally undetectable in HCT116 and RKO colon cancer cells, which exhibit GATA-5 promoter methylation. Adenovirus (AdGATA-5) overexpression of GATA-5 results in a strong expression of the expected Mr 45,000 form in both cancer cell lines. The virus expressing the Escherichia coli β-galactosidase gene was used as negative control (Adβgal). (C) RT-PCR analyses of expression for GATA-5 target genes. RNA was extracted from adenovirus-infected cells for PCR analyses for expression of each gene. Note that GATA-5 overexpression induces reexpression of each candidate target gene, except for TTF3 in all cell lines and TFF2 in RKO and AZ521 cells, where the gene is homozygously mutated and/or deleted, in each cell line where basal expression is absent. (D) Immunoblotting with anti-TFF1 antibody in culture medium collected after 48 h from a positive control GC cell line MKN45, which has an unmethylated and expressed TFF1 gene, and colon cancer HCT116 cells in which the gene is hypermethylated and silenced. Note the TFF1 protein in the MKN45 cell media but only in the HCT116 media when cells are infected with adeno-GATA-5 but not when cells are infected with adeno-β-Gal. The RPMI culture medium used for MKN45 and the McCoy's 5A medium used for HCT116 cells are shown as additional negative controls. (E) MSP analyses of 5′ region methylation status of inhibinα and TFF1 before and after overexpression of GATA-5.

Similar articles

Cited by

References

    1. Al-Azzeh, E. D., P. Fegert, N. Blin, and P. Gott. 2000. Transcription factor GATA-6 activates expression of gastroprotective trefoil genes TFF1 and TFF2. Biochim. Biophys. Acta 1490:324-332. - PubMed
    1. Azarschab, P., E. Al-Azzeh, W. Kornberger, and P. Gott. 2001. Aspirin promotes TFF2 gene activation in human gastric cancer cell lines. FEBS Lett. 488:206-210. - PubMed
    1. Bai, Y., Y. Akiyama, H. Nagasaki, O. K. Yagi, Y. Kikuchi, N. Saito, K. Takeshita, T. Iwai, and Y. Yuasa. 2000. Distinct expression of CDX2 and GATA4/5, development-related genes, in human gastric cancer cell lines. Mol. Carcinog. 28:184-188. - PubMed
    1. Bird, A. 2002. DNA methylation patterns and epigenetic memory. Genes Dev. 16:6-21. - PubMed
    1. Boudreau, F., E. H. Rings, H. M. van Wering, R. K. Kim, G. P. Swain, S. D. Krasinski, J. Moffett, R. J. Grand, E. R. Suh, and P. G. Traber. 2002. Hepatocyte nuclear factor-1α, GATA-4, and caudal related homeodomain protein Cdx2 interact functionally to modulate intestinal gene transcription. Implication for the developmental regulation of the sucrase-isomaltase gene. J. Biol. Chem. 277:31909-31917. - PubMed

Publication types