

Comparative Study
doi: 10.1186/gb-2003-4-11-r76.
Epub 2003 Oct 24.
Application of independent component analysis to microarrays
Affiliations
- PMID: 14611662
- PMCID: PMC329130
- DOI: 10.1186/gb-2003-4-11-r76
Item in Clipboard
Comparative Study
Application of independent component analysis to microarrays
Genome Biol.
2003.
Abstract
We apply linear and nonlinear independent component analysis (ICA) to project microarray data into statistically independent components that correspond to putative biological processes, and to cluster genes according to over- or under-expression in each component. We test the statistical significance of enrichment of gene annotations within clusters. ICA outperforms other leading methods, such as principal component analysis, k-means clustering and the Plaid model, in constructing functionally coherent clusters on microarray datasets from Saccharomyces cerevisiae, Caenorhabditis elegans and human.
Figures
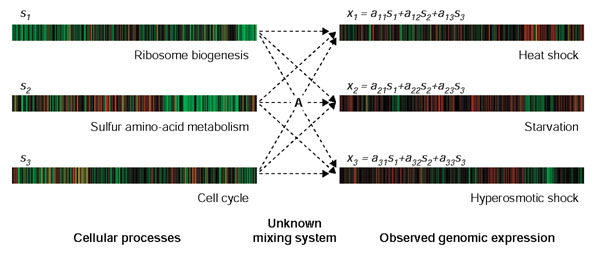
Model of gene expression within a cell. Each genomic expression pattern at a given condition, denoted by xi, is modeled as linear combination of genomic expression programs of independent biological processes. The level of activity of each biological process is different in each environmental condition. The mixing matrix A contains the linear coefficients aij, where aij = activity level of process j in condition i. The example shown uses data generated by Gasch et al. [48].
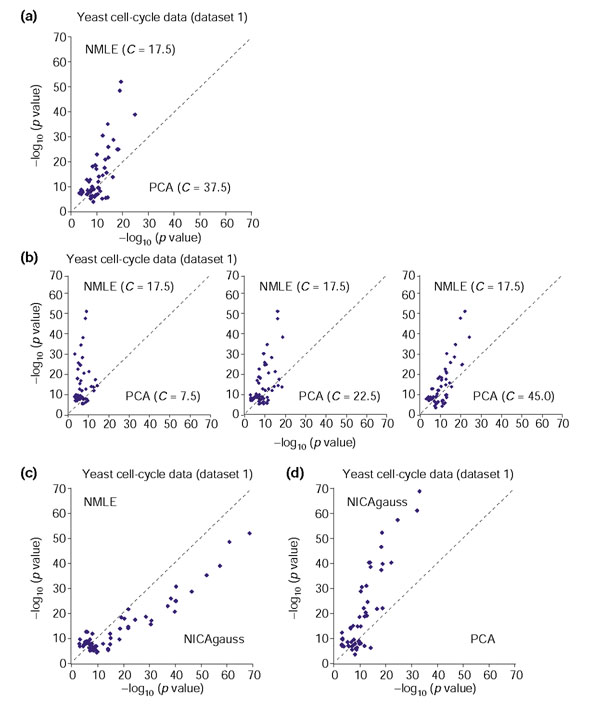
Comparison of linear ICA (NMLE), nonlinear ICA with Gaussian RBF kernel (NICAgauss), and PCA, on the yeast cell cycle spotted array data (dataset 1). For each functional category within GO and KEGG, the value of -log10 (p value) with the smallest p value from one method is plotted against the corresponding value from the other method. (a) Gene clusters based on the linear ICA components are compared with those based on PCA when C for PCA is fixed to its optimal value 37.5. (b) Gene clusters based on the linear ICA components are compared with those based on PCA with different values of C. (c) Gene clusters based on the nonlinear ICA components are compared with those based on linear ICA. (d) Gene clusters based on the nonlinear ICA components are compared with those based on PCA. Overall, nonlinear ICA performed slightly better than NMLE, and both methods performed significantly better than PCA.
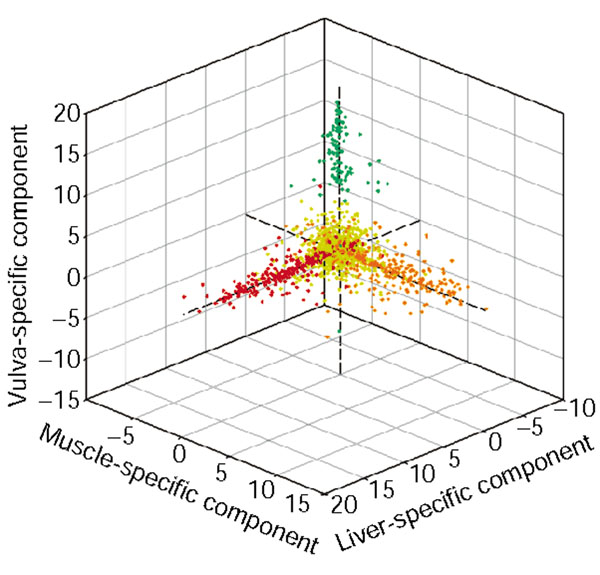
Three independent components of the human normal tissue data (dataset 5). Each gene is mapped to a point based on the value assigned to the gene in the 14th (x-axis), 15th (y-axis) and 55th (z-axis) independent components, which are enriched with liver-specific (red), muscle-specific (orange), and vulva-specific (green) genes, respectively. Genes not annotated as liver-, muscle- or vulva-specific are colored yellow.
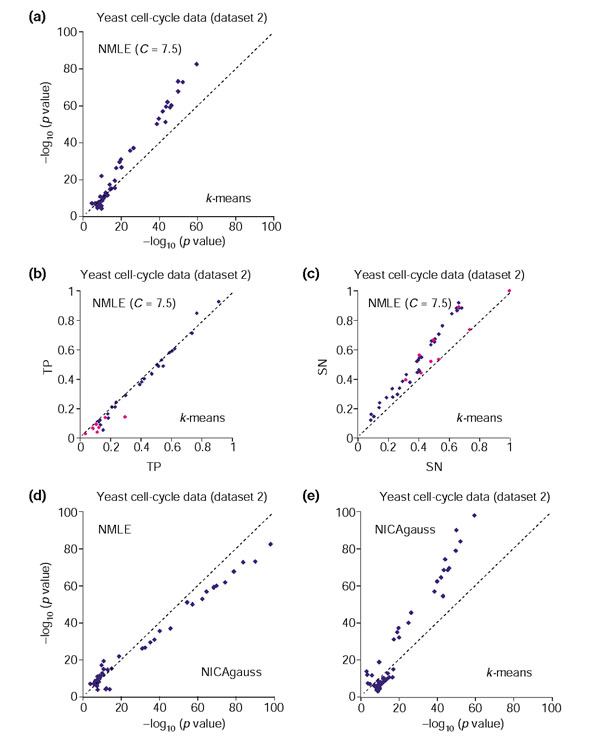
Comparison of linear ICA (NMLE), nonlinear ICA with Gaussian RBF kernel (NICAgauss), and k-means clustering on the yeast cell cycle oligonucleotide array data (dataset 2). For each GO and KEGG functional category, the largest -log10(p value) within clusters from one method is plotted against the corresponding value from the other method. (a) Gene clusters based on the linear ICA components are compared with those based on k-means clustering. (b) TP (True Positives) of gene clusters based on the linear ICA components are compared with those of gene clusters based on k-means clustering. Functional categories for which clusters from NMLE have larger p values than those from k-means clustering algorithm are colored in purple. (c) SN (Sensitivity) of gene clusters based on the linear ICA components are compared with gene clusters based on k-means clustering. Functional categories corresponding to the ones in purple in Figure 4b are colored in purple. (d) Gene clusters based on the nonlinear ICA components are compared with those based on linear ICA. (e) Gene clusters based on the nonlinear ICA components are compared with those based on k-means clustering. Overall, nonlinear ICA performed better than NMLE and both methods performed better than k-means clustering.
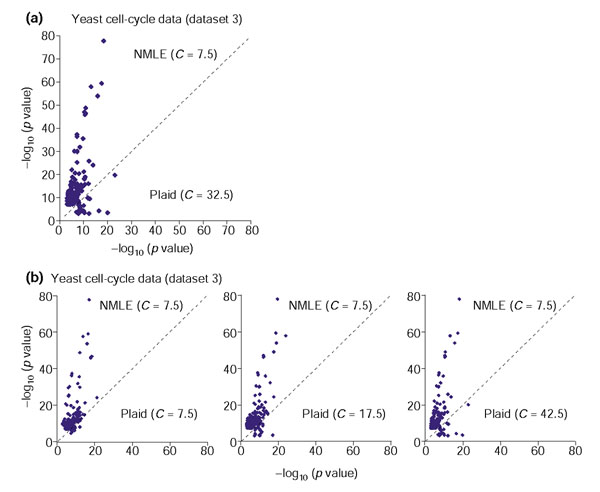
Comparison of linear ICA (NMLE) with the Plaid models, on the yeast stress spotted array dataset (dataset 3). For each GO and KEGG functional category, the largest -log10(p value) within clusters from one method is plotted against the corresponding value from the other method. (a) Gene clusters based on the NMLE components are compared with those based on the Plaid model when C for the Plaid model is fixed to its optimal value 32.5. (b) Gene clusters based on the linear ICA components are compared with those based on the Plaid model with different values of C.
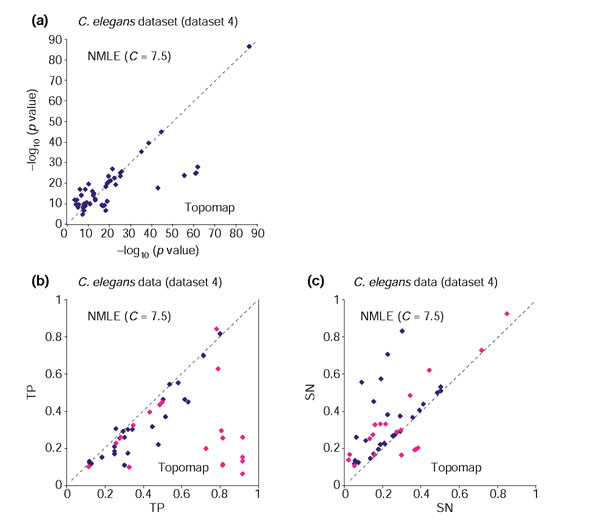
Comparison of linear ICA (NMLE) versus topomap-based clustering on the C. elegans spotted array dataset (dataset 4). For each functional category within GO and KEGG, the value of -log10 (p value) with the smallest p value from NMLE is plotted against the corresponding value from the topomap method. (a) Gene clusters based on the NMLE components are compared with those based on the Topomap method. The two methods performed comparably, as most points of low p values fall on the x = y axis. (b) TP (True Positives) of functional categories from gene clusters based on the NMLE components are compared with those of functional categories from gene clusters based on the topomap method. Functional categories for which clusters from NMLE have larger p values than those from topomap method are colored in purple. (c) SN (Sensitivity) of functional categories from gene clusters based on the linear NMLE and topomap clusters. Functional categories corresponding to the ones in purple in Figure 6b are colored in purple.
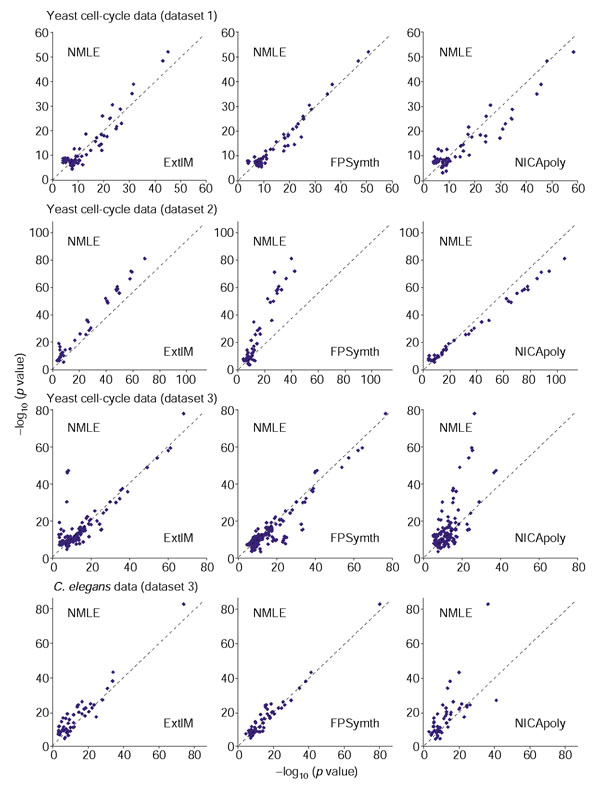
Comparison of NMLE with other ICA approaches. Comparison of the NMLE ICA algorithm with three other ICA approaches on two yeast cell cycle data (dataset 1 and 2), yeast stress data (dataset 3), and C. elegans data (dataset 4). Eight different ICA algorithms and variations (Table 4) were compared. The full comparison is shown in the web supplement. Overall, NMLE, ExtIM and FPsymth performed similarly except in the dataset 2. NICApoly performed comparably with NICAgauss. Both nonlinear approaches were better than NMLE in the two smaller datasets, but performed relatively poorly in the two larger datasets.
Similar articles
-
Decomposing gene expression into cellular processes.Pac Symp Biocomput. 2003:89-100. doi: 10.1142/9789812776303_0009. Pac Symp Biocomput. 2003. PMID: 12603020
-
Influence of microarrays experiments missing values on the stability of gene groups by hierarchical clustering.BMC Bioinformatics. 2004 Aug 23;5:114. doi: 10.1186/1471-2105-5-114. BMC Bioinformatics. 2004. PMID: 15324460 Free PMC article.
-
Possibilistic approach for biclustering microarray data.Comput Biol Med. 2007 Oct;37(10):1426-36. doi: 10.1016/j.compbiomed.2007.01.005. Epub 2007 Mar 8. Comput Biol Med. 2007. PMID: 17346690
-
Discovering patterns in microarray data.Mol Diagn. 2000 Dec;5(4):349-57. doi: 10.1007/BF03262096. Mol Diagn. 2000. PMID: 11172499 Review.
-
Clustering methods for microarray gene expression data.OMICS. 2006 Winter;10(4):507-31. doi: 10.1089/omi.2006.10.507. OMICS. 2006. PMID: 17233561 Review.
Cited by
-
K1 and K15 of Kaposi's Sarcoma-Associated Herpesvirus Are Partial Functional Homologues of Latent Membrane Protein 2A of Epstein-Barr Virus.J Virol. 2015 Jul;89(14):7248-61. doi: 10.1128/JVI.00839-15. Epub 2015 May 6. J Virol. 2015. PMID: 25948739 Free PMC article.
-
Integrating genome-wide genetic variations and monocyte expression data reveals trans-regulated gene modules in humans.PLoS Genet. 2011 Dec;7(12):e1002367. doi: 10.1371/journal.pgen.1002367. Epub 2011 Dec 1. PLoS Genet. 2011. PMID: 22144904 Free PMC article.
-
robustica: customizable robust independent component analysis.BMC Bioinformatics. 2022 Dec 5;23(1):519. doi: 10.1186/s12859-022-05043-9. BMC Bioinformatics. 2022. PMID: 36471244 Free PMC article.
-
Independent Component Analysis for Unraveling the Complexity of Cancer Omics Datasets.Int J Mol Sci. 2019 Sep 7;20(18):4414. doi: 10.3390/ijms20184414. Int J Mol Sci. 2019. PMID: 31500324 Free PMC article. Review.
-
Trimming of mammalian transcriptional networks using network component analysis.BMC Bioinformatics. 2010 Oct 13;11:511. doi: 10.1186/1471-2105-11-511. BMC Bioinformatics. 2010. PMID: 20942926 Free PMC article.
References
-
- Butte A. The use and analysis of microarray data. Nat Rev Drug Discov. 2002;1:951–960. - PubMed
-
- Golub TR, Slonim DK, Tamayo P, Huard C, Gaasenbeek M, Mesirov JP, Coller H, Loh ML, Downing JR, Caligiuri MA, et al. Molecular classification of cancer: class discovery and class prediction by gene expression monitoring. Science. 1999;286:531–537. - PubMed
-
- Mukherjee S, Tamayo P, Mesirov JP, Slonim D, Verri A, Poggio T. Technical Report No 182, AI Memo 1676. MIT, Cambridge: Massachusetts Institute of Technology; 1999. Support vector machine classification of microarray data.
Publication types
MeSH terms
LinkOut - more resources
Full Text Sources
Other Literature Sources
Molecular Biology Databases
Miscellaneous
