

Functional deactivations: change with age and dementia of the Alzheimer type
- PMID: 14608034
- PMCID: PMC283621
- DOI: 10.1073/pnas.2235925100
Functional deactivations: change with age and dementia of the Alzheimer type
Abstract
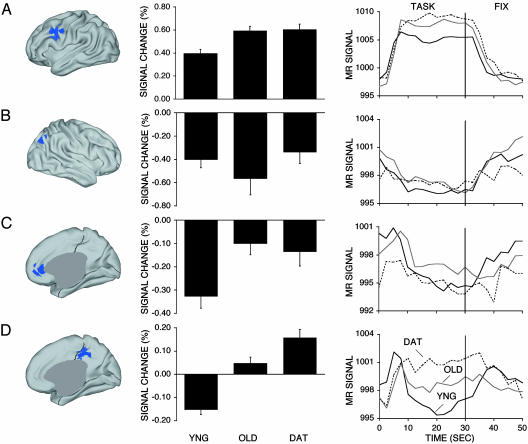
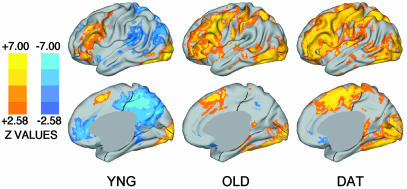
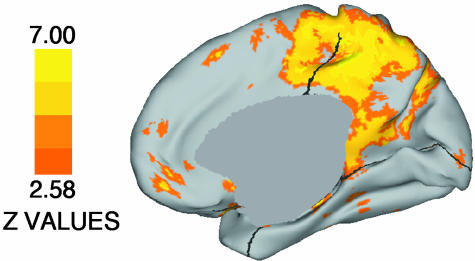
Young adults typically deactivate specific brain regions during active task performance. Deactivated regions overlap with those that show reduced resting metabolic activity in aging and dementia, raising the possibility of a relation. Here, the magnitude and dynamic temporal properties of these typically deactivated regions were explored in aging by using functional MRI in 82 participants. Young adults (n = 32), older adults without dementia (n = 27), and older adults with early-stage dementia of the Alzheimer type (DAT) (n = 23) were imaged while alternating between blocks of an active semantic classification task and a passive fixation baseline. Deactivation in lateral parietal regions was equivalent across groups; in medial frontal regions, it was reduced by aging but was not reduced further by DAT. Of greatest interest, a medial parietal/ posterior cingulate region showed differences between young adults and older adults without dementia and an even more marked difference with DAT. The temporal profile of the medial parietal/posterior cingulate response suggested that it was initially activated by all three groups, but the response in young adults quickly reversed sign, whereas DAT individuals maintained activation throughout the task block. Exploratory whole-brain analyses confirmed the importance of medial parietal/posterior cingulate cortex differences in aging and DAT. These results introduce important opportunities to explore the functional properties of regions showing deactivations, how their dynamic functional properties relate to their baseline metabolic rates, and how they change with age and dementia.
Figures
Similar articles
-
Task-induced deactivations during successful paired associates learning: an effect of age but not Alzheimer's disease.Neuroimage. 2006 Jun;31(2):818-31. doi: 10.1016/j.neuroimage.2005.12.045. Epub 2006 Feb 23. Neuroimage. 2006. PMID: 16497521
-
Differences between Alzheimer's disease and dementia with Lewy bodies: an fMRI study of task-related brain activity.Brain. 2006 Jul;129(Pt 7):1780-8. doi: 10.1093/brain/awl102. Epub 2006 May 2. Brain. 2006. PMID: 16670180
-
Preserved neural correlates of priming in old age and dementia.Neuron. 2004 Jun 10;42(5):865-75. doi: 10.1016/j.neuron.2004.04.002. Neuron. 2004. PMID: 15182724
-
Imaging the default mode network in aging and dementia.Biochim Biophys Acta. 2012 Mar;1822(3):431-41. doi: 10.1016/j.bbadis.2011.07.008. Epub 2011 Jul 23. Biochim Biophys Acta. 2012. PMID: 21807094 Review.
-
Healthy aging by staying selectively connected: a mini-review.Gerontology. 2014;60(1):3-9. doi: 10.1159/000354376. Epub 2013 Sep 28. Gerontology. 2014. PMID: 24080587 Review.
Cited by
-
Age-related changes in parietal lobe activation during an episodic memory retrieval task.J Neural Transm (Vienna). 2013 May;120(5):799-806. doi: 10.1007/s00702-012-0904-x. Epub 2012 Oct 20. J Neural Transm (Vienna). 2013. PMID: 23086222
-
Dissociable neural mechanisms of cognition and well-being in youth versus healthy aging.Psychol Aging. 2022 Nov;37(7):827-842. doi: 10.1037/pag0000710. Epub 2022 Sep 15. Psychol Aging. 2022. PMID: 36107693 Free PMC article.
-
Covariance PET patterns in early Alzheimer's disease and subjects with cognitive impairment but no dementia: utility in group discrimination and correlations with functional performance.Neuroimage. 2004 Sep;23(1):35-45. doi: 10.1016/j.neuroimage.2004.04.032. Neuroimage. 2004. PMID: 15325350 Free PMC article.
-
Beta-amyloid moderates the relationship between cortical thickness and attentional control in middle- and older-aged adults.Neurobiol Aging. 2022 Apr;112:181-190. doi: 10.1016/j.neurobiolaging.2021.12.012. Epub 2022 Jan 10. Neurobiol Aging. 2022. PMID: 35227946 Free PMC article.
-
Fronto-striatal deficit in Parkinson's disease during semantic event sequencing.Neurobiol Aging. 2008 Mar;29(3):397-407. doi: 10.1016/j.neurobiolaging.2006.10.025. Epub 2006 Dec 8. Neurobiol Aging. 2008. PMID: 17157417 Free PMC article.
References
-
- Reuter-Lorenz, P. A. (2002) Trends Cognit. Neurosci. 6, 394-400. - PubMed
-
- Cabeza, R. (2002) Psychol. Aging 17, 85-100. - PubMed
-
- Gusnard, D. A. & Raichle, M. E. (2001) Nat. Rev. Neurosci. 2, 685-694. - PubMed
-
- Mazoyer, B., Zago, L., Mellet, E., Bricogne, S., Etard, O., Houde, O., Crivello, F., Joliot, M., Petit, L. & Tzourio-Mazoyer, N. (2001) Brain Res. Bull. 54, 287-298. - PubMed
Publication types
MeSH terms
Grants and funding
LinkOut - more resources
Full Text Sources
Medical
