Comparative Study
. 2003 Nov;13(11):2381-90.
doi: 10.1101/gr.1271603.

A biophysical approach to transcription factor binding site discovery

Affiliations
Comparative Study

A biophysical approach to transcription factor binding site discovery

Marko Djordjevic et al. Genome Res. 2003 Nov.

Abstract

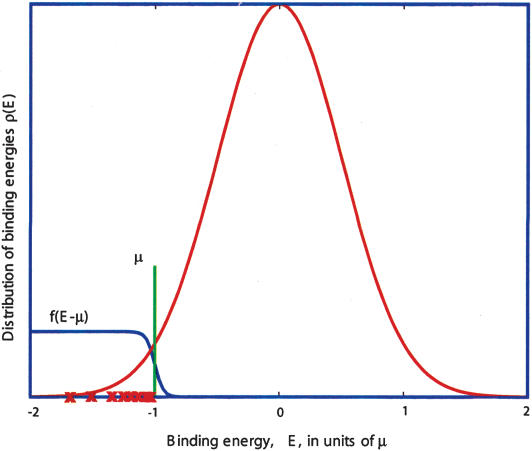
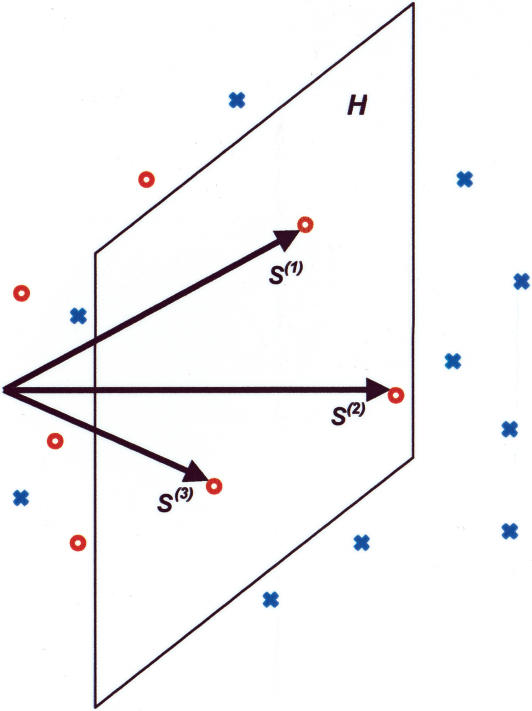
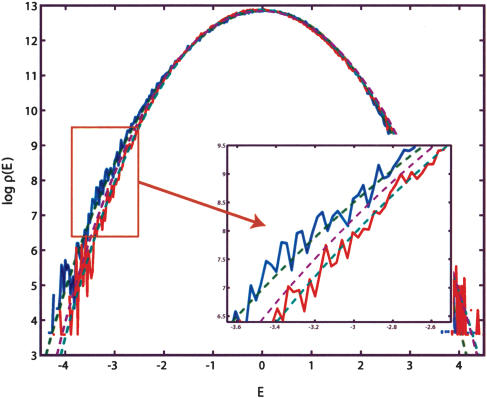
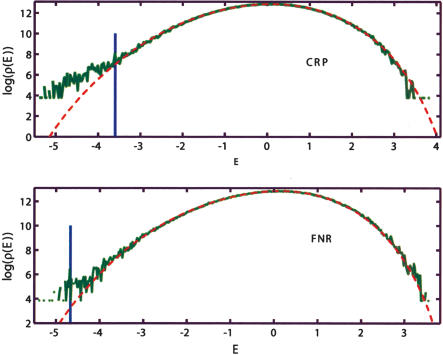
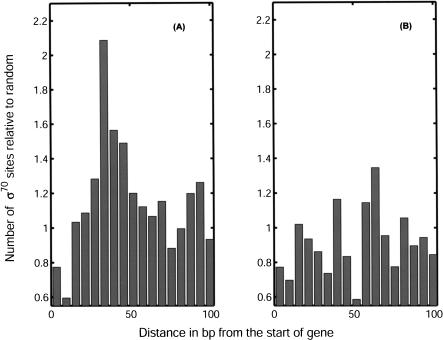
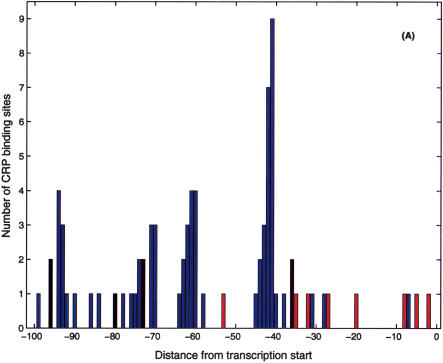
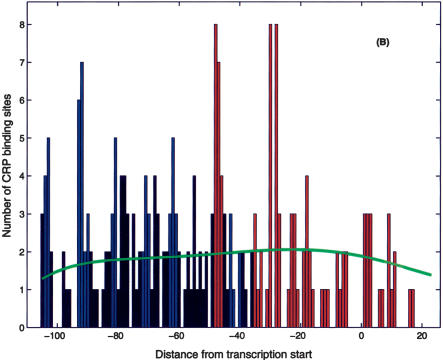
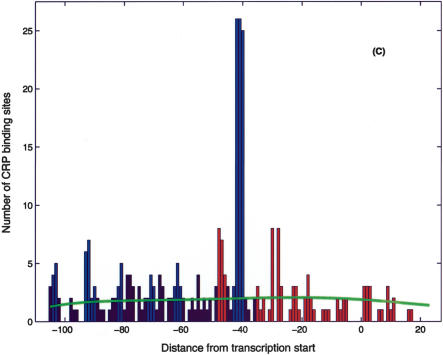
Identification of transcription factor binding sites within regulatory segments of genomic DNA is an important step toward understanding of the regulatory circuits that control expression of genes. Here, we describe a novel bioinformatics method that bases classification of potential binding sites explicitly on the estimate of sequence-specific binding energy of a given transcription factor. The method also estimates the chemical potential of the factor that defines the threshold of binding. In contrast with the widely used information-theoretic weight matrix method, the new approach correctly describes saturation in the transcription factor/DNA binding probability. This results in a significant improvement in the number of expected false positives, particularly in the ubiquitous case of low-specificity factors. In the strong binding limit, the algorithm is related to the "support vector machine" approach to pattern recognition. The new method is used to identify likely genomic binding sites for the E. coli transcription factors collected in the DPInteract database. In addition, for CRP (a global regulatory factor), the likely regulatory modality (i.e., repressor or activator) of predicted binding sites is determined.


Figures

Figure 1
Figure 1
Distribution of binding energies (red curve) in the ensemble of random sequences is approximately Gaussian (although limited to the Emin, Emax interval set by the best and the worst binding sequences, respectively). The blue line represents the binding probability of TF present at a concentration corresponding to the chemical potential µ. The red crosses illustrate possible binding energies of example sequences.
Figure 2
Figure 2
Schematic representation of the quadratic programming problem. Sequences are represented as points in multidimensional space. The red circles represent example binding sites, and blue crosses represent random sequences. The hyperplane H is specified by the energy matrix ε (here considered as a vector) and µ. All example points must be on or to the “left” of the hyperplane. Optimization moves the plane left until it gets “hung up” on the example points (S(1), S(2), S(3) on the figure) so as to minimize the number of random sequences below the binding threshold (i.e., lying to the left of H).
Figure 3
Figure 3
This figure illustrates the importance of the correlation effects in genomic background statistics. The histograms of binding energies are obtained for a randomly chosen ε vector (blue) and its scrambled, that is, position-permuted, version formula image (red). The magenta curve is the theoretical estimate of the binding energy distribution based on a random nucleotide model without correlations, but with the correct one-point statistics of bases. That estimate is the same for ε and formula image. The theoretical energy distribution for model background statistics, which includes correct one- and two- (nearest-neighbor) base statistics, is different for ε and formula image (green curves) is in a much better agreement with the empirical histograms.
Figure 4
Figure 4
Comparison of the empirical and the model genomic background (MGB) binding energy distributions. The empirical distributions obtained by computing E = ε · S for all S in the non-ORF segments of the E. coli K12 genome with ε estimated for CRP and FNR. The MGB includes nearest-neighbor correlations, and the corresponding theoretical distribution is computed as described in Supplemental Appendix A. Both cases exhibit clear overrepresentation of the strongly bound sites. Vertical blue lines indicate the binding threshold estimated on the basis of the known binding sites.
Figure 5
Figure 5
Histograms of positions of candidate σ70 binding sites relative to the nearest downstream ORF. Distance is measured from the 3′ end of the binding site. (A) Histogram corresponding to putative promoter and gene located on the same strand; (B) on opposite strands. The positional distribution of candidate σ70 promoters peaks at 33 bp upstream of the ORF only in the functionally relevant, same strand, configuration.
Figure 6
Figure 6
Positional distribution of CRP site centers relative to the (predicted) transcription start. (A) Known CRP sites (from RegulonDB):(blue) activator sites, (red) repressor sites, (black) unknown. (B) Candidate CRP sites found in the present search with position relative to transcription start inferred from the closest σ70 candidate binding site. Note the significant peaks of the distribution at -62, -72, -82, -93, and -103, that is, Class I positions. Note also the significant peaks at -48 and -29 positions, which we interpret as repressor sites. The proposed functional classification is (blue) activator sites, (red) repressor sites, (black) unknown. (C) Same as B with the addition of putative Class II CRP sites found in the composite CRP-σ70 site search. The green line represents the estimated background distribution.
Figure 6
Figure 6
Positional distribution of CRP site centers relative to the (predicted) transcription start. (A) Known CRP sites (from RegulonDB):(blue) activator sites, (red) repressor sites, (black) unknown. (B) Candidate CRP sites found in the present search with position relative to transcription start inferred from the closest σ70 candidate binding site. Note the significant peaks of the distribution at -62, -72, -82, -93, and -103, that is, Class I positions. Note also the significant peaks at -48 and -29 positions, which we interpret as repressor sites. The proposed functional classification is (blue) activator sites, (red) repressor sites, (black) unknown. (C) Same as B with the addition of putative Class II CRP sites found in the composite CRP-σ70 site search. The green line represents the estimated background distribution.
Figure 7
Figure 7
Positional distribution of candidate H-NS sites (centers) relative to putative RNAP-σ70 sites (centers). (A) All candidate H-NS sites within the represented range of distances. Note the significant peaks at relative positions near -4 and 8, which correspond to direct overlap, and at positions 25, 35, and 52, where H-NS is downstream of the promoter. Horizontal bars correspond to footprinted H-NS sites from Falconi et al. (1998), Lucht et al. (1994), and Soutourina et al. (1999). (B) Same as A but excluding weak candidate RNAP-σ70 promoters (i.e., sites with high E/µ “score”). The disappearance of the -4, 8 peaks indicates that they may function as activators. (*) Estimated background distribution.
Figure 7
Figure 7
Positional distribution of candidate H-NS sites (centers) relative to putative RNAP-σ70 sites (centers). (A) All candidate H-NS sites within the represented range of distances. Note the significant peaks at relative positions near -4 and 8, which correspond to direct overlap, and at positions 25, 35, and 52, where H-NS is downstream of the promoter. Horizontal bars correspond to footprinted H-NS sites from Falconi et al. (1998), Lucht et al. (1994), and Soutourina et al. (1999). (B) Same as A but excluding weak candidate RNAP-σ70 promoters (i.e., sites with high E/µ “score”). The disappearance of the -4, 8 peaks indicates that they may function as activators. (*) Estimated background distribution.
Figure 8
Figure 8
Positional distribution of candidate LRP sites (centers) relative to putative RNAP-σ70 sites (centers). (*) Estimated background distribution.
Figure 9
Figure 9
Comparison of the false-negative fraction versus the number of candidate sites found within the non-ORF fraction of the E. coli K12 genome for the information-based weight matrix (blue) and QPMEME (red) methods. Both CRP site searches are based on the same set of example sites (Robison et al. 1998) and tested against entries in RegulonDB. (⋄) The point corresponding to the QPMEME-derived threshold. The (+) low and (*) high thresholds used in Robison et al. (1998).

Similar articles

Cited by

References

    1. Berg, O.G. and von Hippel, P.H. 1987. Selection of DNA binding sites by regulatory proteins: Statistical-mechanical theory and application to operators and promoters. J. Mol. Biol. 193: 723-750. - PubMed
    1. Blattner, F.R., Plunkett III, G., Bloch, C.A., Perna, N.T., Burland, V., Riley, M., Collado-Vides, J., Glasner, J.D., Rode, C.K., Mayhew, G.F., et al. 1997. The complete genome sequence of E. coli K-12. Science 277: 1453-1462. - PubMed
    1. Bulyk, M.L., Johnson, P.L., and Church, G.M. 2002. Nucleotides of transcription factor binding sites exert interdependent effects on the binding affinities of transcription factors. Nucleic Acids Res. 30: 1255-1261. - PMC - PubMed
    1. Busby, S. and Ebright, R. 1999. Transcription activation by catabolite activator protein (CAP). J. Mol. Biol. 293: 199-213. - PubMed
    1. Cristianini, N. and Shawe-Taylor, J. 2001. An introduction to support vector machines. Cambridge University Press, Cambridge, UK.

Publication types

LinkOut - more resources