. 2004 Feb;15(2):946-56.
doi: 10.1091/mbc.e03-08-0594. Epub 2003 Oct 31.

Tor pathway regulates Rrn3p-dependent recruitment of yeast RNA polymerase I to the promoter but does not participate in alteration of the number of active genes

Affiliations

Tor pathway regulates Rrn3p-dependent recruitment of yeast RNA polymerase I to the promoter but does not participate in alteration of the number of active genes

Jonathan A Claypool et al. Mol Biol Cell. 2004 Feb.

Abstract

Yeast cells entering into stationary phase decrease rRNA synthesis rate by decreasing both the number of active genes and the transcription rate of individual active genes. Using chromatin immunoprecipitation assays, we found that the association of RNA polymerase I with the promoter and the coding region of rDNA is decreased in stationary phase, but association of transcription factor UAF with the promoter is unchanged. Similar changes were also observed when growing cells were treated with rapamycin, which is known to inhibit the Tor signaling system. Rapamycin treatment also caused a decrease in the amount of Rrn3p-polymerase I complex, similar to stationary phase. Because recruitment of Pol I to the rDNA promoter is Rrn3p-dependent as shown in this work, these data suggest that the decrease in the transcription rate of individual active genes in stationary phase is achieved by the Tor signaling system acting at the Rrn3p-dependent polymerase recruitment step. Miller chromatin spreads of cells treated with rapamycin and cells in post-log phase confirm this conclusion and demonstrate that the Tor system does not participate in alteration of the number of active genes observed for cells entering into stationary phase.


Figures
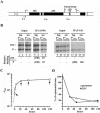
Figure 1.
Figure 1.
Association of Pol I and UAF with rDNA as analyzed by ChIP. (A) Structure of yeast rDNA, which consists of repeats of 9.1-kb-long DNA, showing the initiation site of Pol I (defined as +1) and the positions of PCR products in the ChIP analysis (shown as 1, 2, and 3 for the promoter, the 25S coding region and the NTS region, respectively). (B) Two strains, the wild-type (NOY388, left) and the one carrying HA-tagged RRN5 (NOY798, right) were used for ChIP analyses. Exponentially growing cells (log) and cells in the 5 d (NOY388) and 7 d (NOY798) stationary phase cultures (sta) were treated with formaldehyde. The association of the A190 subunit of Pol I (left) and of the Rrn5p subunit of UAF (right) with the promoter (P) and the 25S rRNA coding region (25S) was then analyzed by ChIP by using anti-A190 and anti-HA antibodies, respectively. PCR reactions were carried out using two different concentrations of DNA and products analyzed by agarose gel electrophoresis are shown. Their amounts were quantified and values for the promoter or the 25S region DNAs bound to A190 or UAF (data indicated as IP or immunoprecipitation) were divided by corresponding values for the DNAs before IP (Input). The values for stationary phase cells obtained in this way were then normalized to the corresponding values (taken as 100%) obtained for log-phase cells and averages of the normalized values for two DNA concentrations are shown. (C) Growth curve of yeast strain carrying HA-tagged RPA135 (NOY654) in YEPD. Cell density (A600) was measured at various times after the first sampling (time 0; A600 0.6). (D) Samples were taken from the culture shown in C at times indicated by arrows and ChIP analyses were done as per the experiment shown in B by using anti-HA antibodies. The degrees of association of Pol I with the promoter and the 25S coding region were calculated as in B, and the normalized values for the degree of association are shown.
Figure 3.
Figure 3.
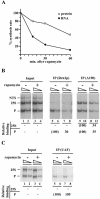
Rapamycin treatment decreases association of Rrn3p and Pol I but not UAF, with rDNA. (A) Strain NOY1170 carrying HA-tagged RRN3 was grown in SD complete medium at 30°C and treated with rapamycin (0.2 μg/ml). Aliquots were taken at indicated times, mixed with [methyl-3H]methionine, and incubated for 5 min. Incorporation of the 3H label into the TCA-insoluble fraction (“protein”; corrected for small amounts of 3H label in RNA) and the RNA fraction (obtained after phenol extraction) was measured. The values normalized for those at the time of rapamycin addition are shown. (B) ChIP analysis of NOY1170 cells was carried out for samples with and without 1-h rapamycin treatment by using anti-HA antibody to measure association of Rrn3p with rDNA and by using anti-A190 to measure association of Pol I with rDNA. Relevant portions of an autoradiogram from a representative experiment are shown. Quantification of PCR products by a PhosphorImager and calculations were done as described in Figure 1. The values obtained for the cells treated with rapamycin were compared with those for the control without rapamycin and values obtained from three independent experiments were averaged (see MATERIALS AND METHODS for variation) and are shown as percentage of control values. (C) Strain NOY798 carrying HA-tagged RRN5 was used and the effects of 1-h rapamycin treatment on the association of UAF with the promoter were examined as described in B.
Figure 2.
Figure 2.
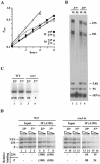
A temperature-sensitive rrn3 mutation (S213P) decreases association of Pol I with the promoter at nonpermissive temperature. (A) Representative growth curves of the rrn3 (S213P) mutant (NOY1075; M) and the control RRN3 (NOY388; W) strains. Cells exponentially growing in SD complete medium at 25°C were divided into two, one shifted to 37°C (time 0) and the other kept at 25°C, and increases in cell density were followed. (B) CEN plasmid pRS316 was introduced into both NOY1075 (M) and NOY388 (W) to make them URA3. The resultant strains were grown as in A, and [3H]uridine was added at 2.5 h after the temperature shift and incubated for 1 h. Control cultures kept at 25°C were also treated in the same way. Aliquots were taken to determine the amounts of [3H]uridine incorporated into the total TCA-insoluble RNA fraction and the remaining cells were used to isolate RNA. RNA samples containing 1 × 10⁵ cpm 3H counts were analyzed by electrophoresis on a polyacrylamide/agarose composite gel. An autoradiogram is shown. The amounts of radioactive RNA corresponding to 25S, 18S, 5.8S, 5S, and tRNA were determined and the ratios of the sum of Pol I transcripts (25S + 18S + 5.8S) to the total (25S + 18S + 5.8S + 5S +tRNA) were calculated. These ratios and the amounts of [3H]uridine incorporated into total RNA were used to calculate the levels of Pol I transcription, yielding the values of 96 and 2.2% for the mutant relative to the wild-type (100%) at 25°C and 37°C, respectively. (C) Both the WT (NOY388) and rrn3 (S213P) mutant (NOY1075) strains were grown in YEPD at 25°C to a cell density of A600 0.2, and the cultures were divided into two, one shifted to 37°C and the other kept at 25°C. Three hours later, portions were used for ChIP analysis shown in D, and the remaining portions were used to isolate RNA. Primer extension analysis was carried out using equal amounts of RNA and the amounts of the 5′ end of 35S pre-rRNA were visualized and quantified by a PhosphorImager. The values normalized to the wild type (WT) at respective temperatures are shown below the radioactive bands. (D) Samples described above were subjected to ChIP analysis by using anti-A190 antibodies to determine the degree of association of Pol I with the promoter, the 25S coding region and NTS. PCR products were quantified by a PhosphorImager, and the values were normalized to those for input were first calculated as % Bound as described in Figure 1. Those values obtained for the rrn3-ts strain were then compared with the corresponding values obtained for WT and are shown as percentage of WT.
Figure 4.
Figure 4.
Decrease in the association of Rrn3p with Pol I after rapamycin treatment as analyzed by coimmunoprecipitation. Cellular extracts were prepared from NOY1170 cells carrying HA-tagged RRN3 treated with rapamycin for 1 h and from untreated cells. Pol I was immunoprecipitated with anti-A190 antibodies. Increasing amounts of the immunoprecipitated proteins (4, 6, and 8 μl) were subjected to Western blot analysis by using antibodies against the Pol I A135 subunit and the HA tag. Quantitation indicated that the amount of Rrn3p relative to Pol I in the immunoprecipitates for the rapamycin treated cells was 38% of that for the untreated cells.
Figure 5.
Figure 5.
Representative electron micrographs of rRNA genes from various growth conditions. (A) Log-phase cells, A600 ∼0.4. (B) Log phase cells exposed to 0.2 μg/ml rapamycin for 10 min. (C) Log-phase cells exposed to 0.2 μg/ml rapamycin for 30 min. (D) Post-log phase cells, A600 ∼2.8. Bar, 0.5 μm (all at same magnification). Note that the polymerase density decreases with exposure to rapamycin (A-C) but that individual genes remain active. In post-log phase cells, inactive genes are sometimes seen, as shown by the transcript-free interval in D. Although the genes shown in D exhibit relatively short transcripts, this is not a general observation for post-log phase cells. Rather, many transcripts seem to be normal length with characteristic terminal balls (our unpublished data).
Figure 6.
Figure 6.
Decrease in polymerase density per gene in rapamycin-treated and post-log phase cells. The number of polymerases per gene is shown for four conditions: log phase, 10-min rapamycin, 30-min rapamycin, and post-log phase. Note the shift to lower average polymerase density with the increasing time of rapamycin treatment and also as cells leave logarithmic growth phase (post-log phase). Quantitative data for the four samples are shown in Table 2.

Similar articles

Cited by

References

    1. Aprikian, P., Moorefield, B., and Reeder, R.H. (2001). New model for the yeast RNA polymerase I transcription cycle. Mol. Cell Biol. 21, 4847-4855. - PMC - PubMed
    1. Barbet, N.C., Schneider, U., Helliwell, S.B., Stansfield, I., Tuite, M.F., and Hall, M.N. (1996). TOR controls translation initiation and early G1 progression in yeast. Mol. Biol. Cell 7, 25-42. - PMC - PubMed
    1. Bodem, J., Dobreva, G., Hoffmann-Rohrer, U., Iben, S., Zentgraf, H., Delius, H., Vingron, M., and Grummt, I. (2000). TIF-IA, the factor mediating growth-dependent control of ribosomal RNA synthesis, is the mammalian homolog of yeast Rrn3p. EMBO Rep. 1, 171-175. - PMC - PubMed
    1. Broach, J.R. (1991). RAS genes in Saccharomyces cerevisiae: signal transduction in search of a pathway. Trends Genet. 7, 28-33. - PubMed
    1. Brun, R.P., Ryan, K., and Sollner-Webb, B. (1994). Factor C*, the specific initiation component of the mouse RNA polymerase I holoenzyme, is inactivated early in the transcription process. Mol. Cell. Biol. 14, 5010-5021. - PMC - PubMed

Publication types

MeSH terms

LinkOut - more resources