. 2003 Oct 27;163(2):351-62.
doi: 10.1083/jcb.200309020.

The AP-1A and AP-1B clathrin adaptor complexes define biochemically and functionally distinct membrane domains

Affiliations

The AP-1A and AP-1B clathrin adaptor complexes define biochemically and functionally distinct membrane domains

Heike Fölsch et al. J Cell Biol. .

Abstract

Most epithelial cells contain two AP-1 clathrin adaptor complexes. AP-1A is ubiquitously expressed and involved in transport between the TGN and endosomes. AP-1B is expressed only in epithelia and mediates the polarized targeting of membrane proteins to the basolateral surface. Both AP-1 complexes are heterotetramers and differ only in their 50-kD mu1A or mu1B subunits. Here, we show that AP-1A and AP-1B, together with their respective cargoes, define physically and functionally distinct membrane domains in the perinuclear region. Expression of AP-1B (but not AP-1A) enhanced the recruitment of at least two subunits of the exocyst complex (Sec8 and Exo70) required for basolateral transport. By immunofluorescence and cell fractionation, the exocyst subunits were found to selectively associate with AP-1B-containing membranes that were both distinct from AP-1A-positive TGN elements and more closely apposed to transferrin receptor-positive recycling endosomes. Thus, despite the similarity of the two AP-1 complexes, AP-1A and AP-1B exhibit great specificity for endosomal transport versus cell polarity.


Figures
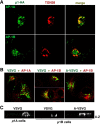
Figure 1.
Figure 1.
AP-1A and AP-1B colocalize with their respective cargoes. (A) LLC-PK1 cells stably transfected with μ1A-HA or μ1B-HA were transiently transfected with cDNAs encoding TGN38. 24 h after transfection, cells were fixed and stained with anti-TGN38 (red) and anti-HA (green). (B) LLC-PK1::μ1A-HA or LLC-PK1::μ1B-HA were microinjected with cDNAs encoding either VSVG-GFP or an apical mutant A-VSVG-GFP. Cells were incubated at 39°C followed by incubation at 20°C. Subsequently, cells were incubated at 31°C for 10 min. Cells were fixed and stained with anti-HA (red). Note that in the case of VSVG expression in AP-1B cells, microinjected cells from two different fields were taken. (C) LLC-PK1::μ1A or μ1B cells were grown on polycarbonate filters for 4 d, microinjected with cDNAs encoding VSVG or A-VSVG, and incubated at 31°C. Surface appearance was monitored by incubating cells with anti-VSVG antibodies before fixation followed by incubation with Alexa® 594–labeled secondary antibodies. (A–C) Specimens were analyzed by confocal microscopy and representative images are shown. (D) Cells from three independent experiments were scored for at least partial overlapping staining. Cells that showed overlapping staining are expressed as percentage of the total number of cells analyzed.
Figure 1.
Figure 1.
AP-1A and AP-1B colocalize with their respective cargoes. (A) LLC-PK1 cells stably transfected with μ1A-HA or μ1B-HA were transiently transfected with cDNAs encoding TGN38. 24 h after transfection, cells were fixed and stained with anti-TGN38 (red) and anti-HA (green). (B) LLC-PK1::μ1A-HA or LLC-PK1::μ1B-HA were microinjected with cDNAs encoding either VSVG-GFP or an apical mutant A-VSVG-GFP. Cells were incubated at 39°C followed by incubation at 20°C. Subsequently, cells were incubated at 31°C for 10 min. Cells were fixed and stained with anti-HA (red). Note that in the case of VSVG expression in AP-1B cells, microinjected cells from two different fields were taken. (C) LLC-PK1::μ1A or μ1B cells were grown on polycarbonate filters for 4 d, microinjected with cDNAs encoding VSVG or A-VSVG, and incubated at 31°C. Surface appearance was monitored by incubating cells with anti-VSVG antibodies before fixation followed by incubation with Alexa® 594–labeled secondary antibodies. (A–C) Specimens were analyzed by confocal microscopy and representative images are shown. (D) Cells from three independent experiments were scored for at least partial overlapping staining. Cells that showed overlapping staining are expressed as percentage of the total number of cells analyzed.
Figure 2.
Figure 2.
VSVG colocalizes with AP-1B in clathrin-coated vesicles and buds. (A–D) LLC-PK1::μ1A-HA (B) or LLC-PK1::μ1B-HA (A, C, and D) were infected with defective adenoviruses encoding VSVG as described in Fig. 1 and analyzed by immuno-EM (see Materials and methods). Small arrows denote labeling for μ1A or μ1B (5-nm gold) on clathrin-coated buds and vesicles. Large arrowheads point to coated buds and vesicles doubly labeled for μ1B and VSVG (A, C, and D). Asterisks, multivesicular endosomes; G, Golgi apparatus. Bars, 100 nm. (E) The labeling density for μ1A/B and VSVG was estimated in AP-1A– and AP-1B–expressing cells as described in Materials and methods. Results are expressed as number of gold particles per length of membrane in μm. Each result is the mean average from three labeling experiments ± SEM.
Figure 3.
Figure 3.
AP-1A and AP-1B do not colocalize. (A) LLC-PK1::μ1A-HA or μ1B-HA cells seeded on coverslips were infected with a defective adenovirus encoding μ1B-myc. Subsequently, cells were fixed and stained with anti-myc (red) and anti-HA (green). Specimens were analyzed by confocal microscopy, and representative images are shown. The left panel shows a cluster of cells only stained for μ1B-myc to demonstrate the TGN localization of AP-1B–myc.
Figure 4.
Figure 4.
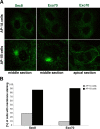
Localization of Sec8 and Exo70 in μ1B-expressing LLC-PK1 cells. (A) LLC-PK1 cells stably expressing μ1A (top) or μ1B (bottom) were grown on coverslips, fixed, and stained with anti-Sec8 or anti-Exo70 (green). (B) LLC-PK1::μ1A or μ1B cells immunolabeled for Sec8 or Exo70 were analyzed for detectable membrane staining, and were expressed as a percentage of the total number of cells counted (from five individual experiments). (C) LLC-PK1::μ1B cells were grown on coverslips, fixed, and stained with anti-Exo70 (green) in combination with anti-GM130, anti-furin, or anti-γ-adaptin (in red). For costaining with Tfn, cells were infected with a defective adenovirus encoding hTfnR. After 1 d, cells were manipulated for the uptake of Alexa® 594–labeled Tfn into recycling endosomes, fixed, and immunolabeled for Exo70 (green). (D) LLC-PK1::μ1B cells grown on coverslips were infected with defective adenoviruses encoding VSVG-ts045-GFP and incubated for 5 h at 37°C, followed by an overnight incubation at 39°C. Cells were then incubated for 2 h at 20°C and fixed directly (top panels) or chased for 10 min at 31°C (bottom panels) before fixation. Fixed cells were immunolabeled for GM130 (blue) and Exo70 (red). Arrows denote the Exo70-positive region. (A, C, and D) Specimens were analyzed by confocal microscopy, and representative merged images are shown.
Figure 4.
Figure 4.
Localization of Sec8 and Exo70 in μ1B-expressing LLC-PK1 cells. (A) LLC-PK1 cells stably expressing μ1A (top) or μ1B (bottom) were grown on coverslips, fixed, and stained with anti-Sec8 or anti-Exo70 (green). (B) LLC-PK1::μ1A or μ1B cells immunolabeled for Sec8 or Exo70 were analyzed for detectable membrane staining, and were expressed as a percentage of the total number of cells counted (from five individual experiments). (C) LLC-PK1::μ1B cells were grown on coverslips, fixed, and stained with anti-Exo70 (green) in combination with anti-GM130, anti-furin, or anti-γ-adaptin (in red). For costaining with Tfn, cells were infected with a defective adenovirus encoding hTfnR. After 1 d, cells were manipulated for the uptake of Alexa® 594–labeled Tfn into recycling endosomes, fixed, and immunolabeled for Exo70 (green). (D) LLC-PK1::μ1B cells grown on coverslips were infected with defective adenoviruses encoding VSVG-ts045-GFP and incubated for 5 h at 37°C, followed by an overnight incubation at 39°C. Cells were then incubated for 2 h at 20°C and fixed directly (top panels) or chased for 10 min at 31°C (bottom panels) before fixation. Fixed cells were immunolabeled for GM130 (blue) and Exo70 (red). Arrows denote the Exo70-positive region. (A, C, and D) Specimens were analyzed by confocal microscopy, and representative merged images are shown.
Figure 5.
Figure 5.
AP-1B colocalizes with Sec8 and Exo70. LLC-PK1::μ1A cells were infected with a defective adenovirus encoding μ1B-myc. After 24 h, cells were fixed and immunolabeled for μ1B-myc (red) and Sec8 or Exo70 (green). Specimens were analyzed by confocal microscopy, and representative images are shown.
Figure 6.
Figure 6.
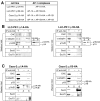
Biochemical analysis of AP-1A and AP-1B vesicles. (A) Table of used cell lines. (B) AP-1–HA coat components from LLC-PK1::μ1A-HA or μ1B-HA cells were immunoisolated using anti-HA antibodies as described in Materials and methods. Immunoprecipitates were dissolved in sample buffer and analyzed by SDS-PAGE and Western blotting using the indicated antibodies. T = 1% of the pellet fraction used for the immunoprecipitations. 100,000 g S and P = 0.1% of the supernatant and 1% of the pellet fractions, respectively, of the high speed spin used to obtain the crude CCV pellets. (C) AP-1–HA coat components from Caco-2 cells were isolated and analyzed as described in B. (B and C) The sample for the total input was not run directly next to the immunoprecipitation lanes, but cropped next to them after scanning of the data.
Figure 7.
Figure 7.
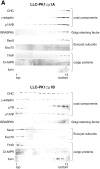
AP-1B–coated membranes float in linear density gradients. (A) Crude CCV pellets from LLC-PK1 cells were resuspended in a sucrose buffer and analyzed in linear density gradients (see Materials and methods). 3% of each harvested fraction was subjected to SDS-PAGE and Western blotting (multiple gels were run per experiment). Note, fractions 1–4 and 5–12 were run on two different gels, but processed at the same time. A white line indicates where the scanned data have been cropped together (i.e., all samples from the LLC-PK1::μ1A gradients and the samples from ::μ1B gradients that were probed for γ-adaptin, GRASP65, Sec8, Exo70, and CI-MPR). (B) Crude CCV pellets from Caco-2 cells were analyzed as described in A. Gradient samples were run on the same gel with the exception for the CI-MPR data (compare with A). (C) Crude CCV pellets from LLC-PK1::μ1B-HA cells were analyzed by density gradients as described in A. The top fractions (1–3) were harvested, pooled, and subjected to anti-HA immunoprecipitations as described in Fig. 6, A and B. T = 1% of the total pellet fraction of the initial 100,000-g spin.
Figure 7.
Figure 7.
AP-1B–coated membranes float in linear density gradients. (A) Crude CCV pellets from LLC-PK1 cells were resuspended in a sucrose buffer and analyzed in linear density gradients (see Materials and methods). 3% of each harvested fraction was subjected to SDS-PAGE and Western blotting (multiple gels were run per experiment). Note, fractions 1–4 and 5–12 were run on two different gels, but processed at the same time. A white line indicates where the scanned data have been cropped together (i.e., all samples from the LLC-PK1::μ1A gradients and the samples from ::μ1B gradients that were probed for γ-adaptin, GRASP65, Sec8, Exo70, and CI-MPR). (B) Crude CCV pellets from Caco-2 cells were analyzed as described in A. Gradient samples were run on the same gel with the exception for the CI-MPR data (compare with A). (C) Crude CCV pellets from LLC-PK1::μ1B-HA cells were analyzed by density gradients as described in A. The top fractions (1–3) were harvested, pooled, and subjected to anti-HA immunoprecipitations as described in Fig. 6, A and B. T = 1% of the total pellet fraction of the initial 100,000-g spin.

Similar articles

Cited by

References

    1. Ang, A.L., H. Fölsch, U.-M. Koivisto, and I. Mellman. 2003. The Rab8 GTPase selectively regulates AP-1B–dependent basolateral transport in polarized Madin-Darby canine kidney cells. J. Cell Biol. 163:339–350. - PMC - PubMed
    1. Aroeti, B., and K.E. Mostov. 1994. Polarized sorting of the polymeric immunoglobulin receptor in the exocytotic and endocytotic pathways is controlled by the same amino acids. EMBO J. 13:2297–2304. - PMC - PubMed
    1. Bonifacino, J.S., and E.C. Dell'Angelica. 1999. Molecular bases for the recognition of tyrosine-based sorting signals. J. Cell Biol. 145:923–926. - PMC - PubMed
    1. Brodsky, F.M., C.Y. Chen, C. Knuehl, M.C. Towler, and D.E. Wakeham. 2001. Biological basket weaving: formation and function of clathrin-coated vesicles. Annu. Rev. Cell Dev. Biol. 17:517–568. - PubMed
    1. Brymora, A., V.A. Valova, M.R. Larsen, B.D. Roufogalis, and P.J. Robinson. 2001. The brain exocyst complex interacts with RalA in a GTP-dependent manner: identification of a novel mammalian Sec3 gene and a second Sec15 gene. J. Biol. Chem. 276:29792–29797. - PubMed

Publication types

MeSH terms