

Nonlinear elasticity, proteinquakes, and the energy landscapes of functional transitions in proteins
- PMID: 14566052
- PMCID: PMC240658
- DOI: 10.1073/pnas.2135471100
Nonlinear elasticity, proteinquakes, and the energy landscapes of functional transitions in proteins
Abstract
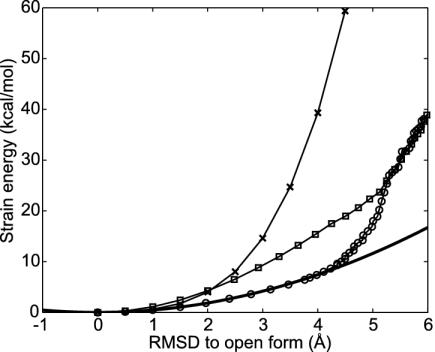
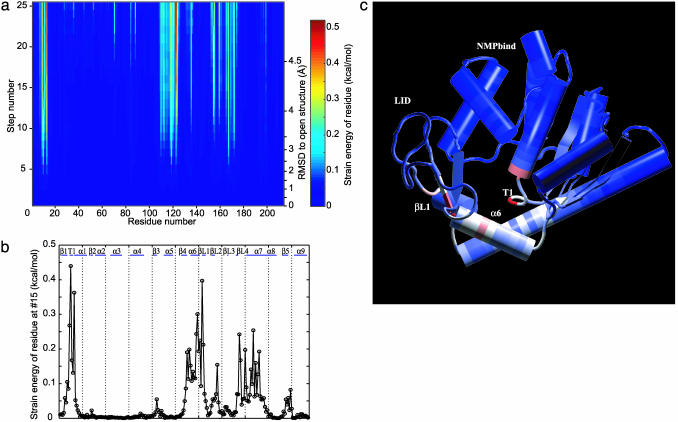
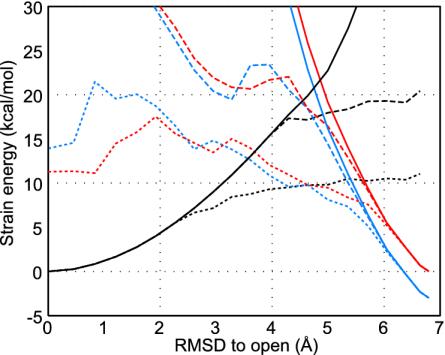
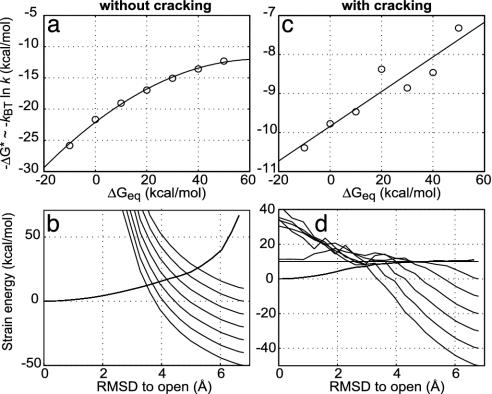
Large-scale motions of biomolecules involve linear elastic deformations along low-frequency normal modes, but for function nonlinearity is essential. In addition, unlike macroscopic machines, biological machines can locally break and then reassemble during function. We present a model for global structural transformations, such as allostery, that involve large-scale motion and possible partial unfolding, illustrating the method with the conformational transition of adenylate kinase. Structural deformation between open and closed states occurs via low-frequency modes on separate reactant and product surfaces, switching from one state to the other when energetically favorable. The switching model is the most straightforward anharmonic interpolation, which allows the barrier for a process to be estimated from a linear normal mode calculation, which by itself cannot be used for activated events. Local unfolding, or cracking, occurs in regions where the elastic stress becomes too high during the transition. Cracking leads to a counterintuitive catalytic effect of added denaturant on allosteric enzyme function. It also leads to unusual relationships between equilibrium constant and rate like those seen recently in single-molecule experiments of motor proteins.
Figures
Similar articles
-
Conformational transitions of adenylate kinase: switching by cracking.J Mol Biol. 2007 Mar 9;366(5):1661-71. doi: 10.1016/j.jmb.2006.11.085. Epub 2006 Dec 5. J Mol Biol. 2007. PMID: 17217965 Free PMC article.
-
Analysis of functional motions in Brownian molecular machines with an efficient block normal mode approach: myosin-II and Ca2+ -ATPase.Biophys J. 2004 Feb;86(2):743-63. doi: 10.1016/S0006-3495(04)74152-1. Biophys J. 2004. PMID: 14747312 Free PMC article.
-
Simple energy landscape model for the kinetics of functional transitions in proteins.J Phys Chem B. 2005 Feb 10;109(5):1959-69. doi: 10.1021/jp046736q. J Phys Chem B. 2005. PMID: 16851180
-
Folding funnels and conformational transitions via hinge-bending motions.Cell Biochem Biophys. 1999;31(2):141-64. doi: 10.1007/BF02738169. Cell Biochem Biophys. 1999. PMID: 10593256 Review.
-
On the relationship between low-frequency normal modes and the large-scale conformational changes of proteins.Arch Biochem Biophys. 2015 Feb 1;567:59-65. doi: 10.1016/j.abb.2014.12.020. Epub 2015 Jan 3. Arch Biochem Biophys. 2015. PMID: 25562404 Review.
Cited by
-
Connecting protein conformational dynamics with catalytic function as illustrated in dihydrofolate reductase.Biochemistry. 2013 Mar 26;52(12):2036-49. doi: 10.1021/bi301559q. Epub 2013 Jan 16. Biochemistry. 2013. PMID: 23297871 Free PMC article.
-
Mapping allostery through computational glycine scanning and correlation analysis of residue-residue contacts.Biochemistry. 2015 Feb 24;54(7):1534-41. doi: 10.1021/bi501152d. Epub 2015 Feb 6. Biochemistry. 2015. PMID: 25658131 Free PMC article.
-
PUMA binding induces partial unfolding within BCL-xL to disrupt p53 binding and promote apoptosis.Nat Chem Biol. 2013 Mar;9(3):163-8. doi: 10.1038/nchembio.1166. Epub 2013 Jan 20. Nat Chem Biol. 2013. PMID: 23340338 Free PMC article.
-
Functional residues serve a dominant role in mediating the cooperativity of the protein ensemble.Proc Natl Acad Sci U S A. 2007 Mar 13;104(11):4347-52. doi: 10.1073/pnas.0607132104. Epub 2007 Mar 5. Proc Natl Acad Sci U S A. 2007. PMID: 17360527 Free PMC article.
-
A transition path ensemble study reveals a linchpin role for Mg(2+) during rate-limiting ADP release from protein kinase A.Biochemistry. 2009 Dec 8;48(48):11532-45. doi: 10.1021/bi901475g. Biochemistry. 2009. PMID: 19886670 Free PMC article.
References
-
- McCammon, J. A., Gelin, B. R., Karplus, M. & Wolynes, P. G. (1976) Nature 262 325–326. - PubMed
-
- Frauenfelder, H., Sligar, S. G. & Wolynes, P. G. (1991) Science 254 1598–1603. - PubMed
-
- Horiuchi, T. & Go, N. (1991) Proteins Struct. Funct. Genet. 10 106–116. - PubMed
-
- Nabarro, F. R. N. (1947) Proc. Phys. Soc. 59 256–272.
-
- Rief, M., Gautel, M., Oesterhelt, F., Fernandez, J. M. & Gaub, H. E. (1997) Science 276 1109–1112. - PubMed
Publication types
MeSH terms
Substances
LinkOut - more resources
Full Text Sources
Other Literature Sources
