. 2003 Nov;15(11):2532-50.
doi: 10.1105/tpc.014928. Epub 2003 Oct 10.

Cytokinin-deficient transgenic Arabidopsis plants show multiple developmental alterations indicating opposite functions of cytokinins in the regulation of shoot and root meristem activity

Affiliations

Cytokinin-deficient transgenic Arabidopsis plants show multiple developmental alterations indicating opposite functions of cytokinins in the regulation of shoot and root meristem activity

Tomás Werner et al. Plant Cell. 2003 Nov.

Abstract

Cytokinins are hormones that regulate cell division and development. As a result of a lack of specific mutants and biochemical tools, it has not been possible to study the consequences of cytokinin deficiency. Cytokinin-deficient plants are expected to yield information about processes in which cytokinins are limiting and that, therefore, they might regulate. We have engineered transgenic Arabidopsis plants that overexpress individually six different members of the cytokinin oxidase/dehydrogenase (AtCKX) gene family and have undertaken a detailed phenotypic analysis. Transgenic plants had increased cytokinin breakdown (30 to 45% of wild-type cytokinin content) and reduced expression of the cytokinin reporter gene ARR5:GUS (beta-glucuronidase). Cytokinin deficiency resulted in diminished activity of the vegetative and floral shoot apical meristems and leaf primordia, indicating an absolute requirement for the hormone. By contrast, cytokinins are negative regulators of root growth and lateral root formation. We show that the increased growth of the primary root is linked to an enhanced meristematic cell number, suggesting that cytokinins control the exit of cells from the root meristem. Different AtCKX-green fluorescent protein fusion proteins were localized to the vacuoles or the endoplasmic reticulum and possibly to the extracellular space, indicating that subcellular compartmentation plays an important role in cytokinin biology. Analyses of promoter:GUS fusion genes showed differential expression of AtCKX genes during plant development, the activity being confined predominantly to zones of active growth. Our results are consistent with the hypothesis that cytokinins have central, but opposite, regulatory functions in root and shoot meristems and indicate that a fine-tuned control of catabolism plays an important role in ensuring the proper regulation of cytokinin functions.


Figures
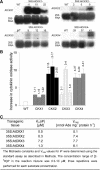
Figure 1.
Figure 1.
AtCKX Gene Expression and Enzyme Activity in Transgenic Arabidopsis Plants. (A) RNA gel blots (50 μg of total RNA) of individual transformants were probed with gene-specific probes that covered the whole genomic sequences. Only clones with enhanced AtCKX transcripts showed a phenotype. A control hybridization was performed with 25S rRNA. WT, wild type. (B) Increase in CKX enzymatic activity in Arabidopsis callus overexpressing single AtCKX genes compared with wild-type callus. The specific activity of extracts of wild-type callus was 32.1 ± 6.4 pmol adenine·mg−1 protein·h−1. Error bars represent se; n = 3. (C) Apparent Km(iP) and maximum velocity (Vmax) values of CKX extracts of Arabidopsis callus overexpressing single AtCKX genes.
Figure 2.
Figure 2.
35S:AtCKX Transgenic Seedlings Have Lower Concentrations of Cytokinins and IAA. (A) Endogenous concentrations of Z-type cytokinin metabolites. (B) Endogenous concentrations of iP-type cytokinin metabolites. (C) Total content of all measured Z-type cytokinin metabolites and iP-type cytokinin metabolites, and the sum of all measured Z- and iP-type cytokinin metabolites. (D) Endogenous concentration of IAA. Seedlings for hormone analysis were grown on soil under long-day conditions. Aerial tissue was collected at the same developmental stage of the plant (i.e., when six leaves were formed). Wild-type and 35S:AtCKX2 plants reached the six-leaf stage at 13 DAG, and 35S:AtCKX1 transgenic plants reached the six-leaf stage at 15 DAG. Three independently pooled samples of ∼150 mg were analyzed for each clone. Error bars represent se; n = 3. CK, cytokinin; IAA, indole-3-acetic acid; iP, N6-(Δ2isopentenyl)adenine; iPG, N6-(Δ2isopentenyl)adenine glucoside; iPR, N6-(Δ2isopentenyl)adenosine; iPRP, N6-(Δ2isopentenyl)adenosine 5′-monophosphate; WT, wild type; Z, zeatin; Z9G, zeatin 9-glucoside; ZR, zeatin riboside; ZRP, zeatin riboside 5′-monophosphate.
Figure 3.
Figure 3.
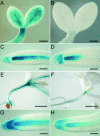
Reduced ARR5:GUS Expression in the 35S:AtCKX1 Transgenic Background. (A) to (D) ARR5:GUS expression in wild-type plants ([A] and [C]) and 35S:AtCKX1 transgenic plants ([B] and [D]) at 2 DAG. (E) to (H) ARR5:GUS expression in wild-type plants ([E] and [G]) and 35S:AtCKX1 transgenic plants ([F] and [H]) at 9 DAG. The duration of staining was 14 h for (A) to (F) and 80 min for (G) and (H). Bars = 200 μm for (A) and (B), 50 μm for (C), (D), (G), and (H), and 1 mm for (E) and (F).
Figure 4.
Figure 4.
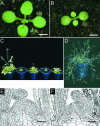
Shoots of 35S:AtCKX-Expressing Arabidopsis Plants Show Retarded Development. (A) and (B) Phenotypes of a wild-type seedling (A) and a homozygote 35S:AtCKX3 transgenic seedling (B) at 10 DAG. (C) Six-week-old plants. From left to right: wild-type, 35S:AtCKX1, 35S:AtCKX2, 35S:AtCKX3, and 35S:AtCKX4 transgenic plants. (D) A 35S:AtCKX1-expressing Arabidopsis plant grown for 4 months under long-day conditions in the greenhouse. Pot diameter is 6 cm. (E) and (F) Median longitudinal sections of the SAMs of wild-type (E) and 35S:AtCKX1-expressing (F) plants. Bars = 2 mm for (A) and (B) and 25 μm for (E) and (F).
Figure 5.
Figure 5.
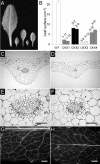
Leaf Development of 35S:AtCKX-Expressing Arabidopsis Plants. (A) Leaf size comparison. The seventh rosette leaves detached from 6-week-old plants are shown. From left to right: leaves from wild-type, 35S:AtCKX1, 35S:AtCKX2, 35S:AtCKX3, and 35S:AtCKX4 transgenic plants. (B) Leaf surface area of the wild type (WT) and two independent homozygous lines of plants overexpressing AtCKX1, AtCKX2, AtCKX3, and AtCKX4. The surface area of leaves from the main rosette was determined at the time of bolting. (C) and (D) Transverse sections through the central part of a fully developed wild-type leaf (C) and a leaf from a 35S:AtCKX1-expressing plant (D). (E) and (F) Magnifications of (C) and (D) showing details of the leaf vascular systems of wild-type (E) and 35S:AtCKX1-expressing (F) plants. (G) and (H) Vascular pattern in the fully expanded seventh rosette leaves of wild-type (G) and 35S:AtCKX1 transgenic (H) plants. ph, phloem; x, xylem. Bars = 50 μm for (E) and (F) and 1 mm for (G) and (H).
Figure 6.
Figure 6.
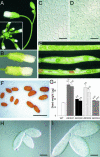
Changes in Reproductive Development of Plants Overexpressing AtCKX Genes. (A) Apical part of an inflorescence of a 35S:AtCKX1 transgenic plant. A wild-type inflorescence is shown in the inset. (B) Comparison of fully developed flowers from wild-type (top) and 35S:AtCKX1 (bottom) plants. (C) and (D) Epidermal cells from the abaxial, distal portion of fully mature wild-type (C) and 35S:AtCKX1 (D) petals. (E) Comparison of silique development in wild type (top) and 35S:AtCKX1 (middle and bottom) plants. 35S:AtCKX1 siliques of two different developmental stages are shown. Both young fruits (middle) and older fruits (bottom) show nonsynchronous ripening and occasionally fail to develop. (F) Comparison of mature seeds of wild-type (left) and AtCKX1-overexpressing (right) plants. (G) Increased biomass of seeds from plants expressing AtCKX genes. The weight of one seed was calculated from the weight of pools of 200 seeds. Error bars represent se; n = 10. WT, wild type. (H) and (I) Whole-mount preparations of the mature embryos of wild-type (H) and AtCKX1-overproducing (I) plants. Bars = 20 μm for (C) and (D), 1 mm for (F), and 200 μm for (H) and (I).
Figure 7.
Figure 7.
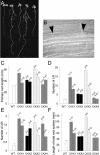
Root Phenotypes of AtCKX-Expressing Transgenic Arabidopsis Plants. (A) Seedlings grown in vitro for 8 days. From left to right: wild-type, 35S:AtCKX1, 35S:AtCKX2, 35S:AtCKX3, and 35S:AtCKX4 transgenic seedlings. (B) Lateral root primordia initiated in close proximity frequently were observed in 35S:AtCKX1 and 35S:AtCKX3 roots but never in wild-type roots. (C) to (F) Morphometric analysis of root growth and development at 8 DAG. Error bars represent se; n ≥ 18. WT, wild type. (C) Length of the primary root. (D) Number of emerged lateral roots (LR). (E) Number of adventitious roots (AR). (F) Length of the entire root system, summarizing the length of the primary root, lateral roots, and adventitious roots.
Figure 8.
Figure 8.
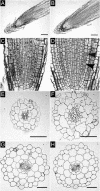
Tissue Organization in Roots and Hypocotyls of 35S:AtCKX-Expressing Arabidopsis Plants. (A) and (B) Longitudinal sections through the root meristems of a wild-type plant (A) and a 35S:AtCKX1 transgenic plant (B). (C) and (D) Periclinal cell divisions in the endodermal tissue of a 35S:AtCKX1 root meristem ([D], arrowheads) were not observed in the wild type (C). (E) and (F) Cross-sections of roots of wild-type (E) and 35S:AtCKX1 transgenic (F) plants. (G) and (H) Cross-sections of hypocotyls of wild-type (G) and 35S:AtCKX1 transgenic (H) plants. Note the decreased diameter of the vascular cylinder. C, cortex; E, endodermis; Ep, epidermis. Bars = 50 μm.
Figure 9.
Figure 9.
Increased Root Meristem Activity in 35S:AtCKX1 Transgenic Plants. (A) and (B) CycB1:GUS expression in mitotic cells of the wild-type root meristem (A) and in the 35S:AtCKX1 transgenic background (B) at 4 DAG. The arrows indicate the zone of dividing cells, defined by the stained meristematic cells. Bars = 100 μm. (C) Statistical evaluation of root length, number of dividing cells per root meristem, relative volume of the RAM (wild-type value of 1.13 × 10⁶ ± 0.06 × 106 μm3 was set as 100%), and average final length of root cortical cells. Error bars represent se; n ≥ 15. WT, wild type.
Figure 10.
Figure 10.
AtCKX1-GFP, AtCKX2-GFP, and AtCKX3-GFP Fusion Proteins Show Different Subcellular Localizations in Stably Transformed Arabidopsis Plants. (A) and (B) Control plants, expressing 35S:GFP, typically had nuclear GFP fluorescence along with cytoplasmic signals. Optical sections through the centers of leaf epidermal cells (A) and root cells (B) are shown. (C) Mitochondrial localization of β-ATPase-GFP in the lower leaf epidermis. Two optical sections through the middle of cells and the cell cortex were merged with the transmission image. (D) to (F) AtCKX2-GFP is associated with the ER in lower epidermal cells of the leaf blade ([D] and [E]) and the petiole (F). The same cell is presented in different confocal sections through the center of the cell (D) and at the level of the cortical ER (E). The inset in (D) shows perinuclear fluorescence in stomatal guard cells. (G) and (H) AtCKX3-GFP is localized in the central vacuole (G) (optical section through the center of the cell) and to ER-like structures in the cortical cytoplasm (H) (section close to the surface of the same cell as in [G]). (I) and (J) Localization of AtCKX3-GFP in vacuoles of different root cell types (I) and higher magnification of epidermal root cells (J) (cf. control shown in [B]). (K) AtCKX1-GFP accumulated in vacuoles of root cells in the central cylinder. Cells were visualized with a confocal laser scanning microscope. Images in (E), (F), and (H) represent projections of three 1-μm sections close to the cell surface. Bars = 10 μm.
Figure 11.
Figure 11.
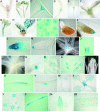
Expression Analysis of AtCKX Gene Promoters. (A) to (D) Localization of AtCKX1:GUS activity. AtCKX1:GUS is expressed in the shoot apex (A) and in young floral tissues (B). In roots, AtCKX1:GUS expression is detected in the pericycle around the root branching points (C) and at the root-hypocotyl junction (D). (E) to (G) Localization of AtCKX2:GUS activity. AtCKX2:GUS expression is observed in the shoot apex (E), stipules (F), and in the apical stem of flowering plants (G). (I) to (M) Localization of AtCKX4:GUS activity. AtCKX:GUS4 is expressed in stipules and young trichomes (H). In leaves, the strongest expression is observed in stomatal meristemoids and clonally related cells (I). In roots, the earliest expression is detected in the root caps of germinating seedlings (J). Expression remains high in the central and lateral columnella at 5 DAG (10-min staining [K] and 80-min staining [L]). Side roots express AtCKX4:GUS at the very tip after their complete emergence (M). (N) to (V) Localization of AtCKX5:GUS activity. AtCKX5:GUS expression is localized at the very base of the youngest emerging leaves, marking the developing leaf petiole ([N] and [O]), and after bolting in the rib zone of the axillary meristems ([P] and [Q]). In flowers, expression is detected in developing stamen ([R] and [S]) and in ripening pollen grains (T). In roots, expression is confined to the vascular cylinder within the apical meristem (U). Expression is strongest in the vascular initials directly adjacent to the quiescent center. The earliest expression in lateral root primordia is detected at the start of vascular proliferation (V). (W) to (ZB) Localization of AtCKX6:GUS activity. Expression in the shoot is confined mainly to the vascular system of young tissues (e.g., cotyledons [W] and expanding leaves [X]) and developing stomatal guard cells of young leaves (Y). In postembryonic roots, expression is first detected at 2 DAG in the vasculature, with expression maxima around lateral root primordia ([W] and [Z]). During later root development, AtCKX6:GUS is expressed equally throughout the whole root vascular cylinder, not reaching the root meristem ([X] and data not shown). In flowers, expression is detected in the gynoecium (ZA) and the funiculus (ZB).

Similar articles

Cited by

References

    1. Aloni, R. (1995). The induction of vascular tissues by auxin and cytokinin. In Plant Hormones: Physiology, Biochemistry and Molecular Biology, P.J. Davies, ed (Dordrecht, The Netherlands: Kluwer Academic Publishers), pp. 531–546.
    1. Armstrong, D.J. (1994). Cytokinin oxidase and the regulation of cytokinin degradation. In Cytokinins: Chemistry, Activity, and Function, D.W.S. Mok and M.C. Mok, eds (Boca Raton, FL: CRC Press), pp. 139–154.
    1. Bannai, H., Tamada, Y., Maruyama, O., Nakai, K., and Miyano, S. (2002). Extensive feature detection of N-terminal protein sorting signals. Bioinformatics 18, 298–305. - PubMed
    1. Baskin, T.I., Cork, A., Williamson, R.E., and Gorst, J.R. (1995). STUNTED PLANT 1, a gene required for expansion in rapidly elongating but not in dividing cells and mediating root growth responses to applied cytokinin. Plant Physiol. 107, 233–243. - PMC - PubMed
    1. Batoko, H., Zheng, H.-Q., Hawes, C., and Moore, I. (2000). A Rab1 GTPase is required for transport between the endoplasmic reticulum and Golgi apparatus and for normal Golgi movement in plants. Plant Cell 12, 2201–2218. - PMC - PubMed

Publication types

MeSH terms