. 2003 Oct;112(7):1037-48.
doi: 10.1172/JCI17935.

Regulatory functions of CD8+CD28- T cells in an autoimmune disease model

Affiliations

Regulatory functions of CD8+CD28- T cells in an autoimmune disease model

Nader Najafian et al. J Clin Invest. 2003 Oct.

Abstract

CD8+ T cell depletion renders CD28-deficient mice susceptible to experimental autoimmune encephalomyelitis (EAE). In addition, CD8-/-CD28-/- double-knockout mice are susceptible to EAE. These findings suggest a role for CD8+ T cells in the resistance of CD28-deficient mice to disease. Adoptive transfer of CD8+CD28- T cells into CD8-/- mice results in significant suppression of disease, while CD8+CD28+ T cells demonstrate no similar effect on the clinical course of EAE in the same recipients. In vitro, CD8+CD28- but not CD8+CD28+ T cells suppress IFN-gamma production of myelin oligodendrocyte glycoprotein-specific CD4+ T cells. This suppression requires cell-to-cell contact and is dependent on the presence of APCs. APCs cocultured with CD8+CD28- T cells become less efficient in inducing a T cell-dependent immune response. Such interaction prevents upregulation of costimulatory molecules by APCs, hence decreasing the delivery of these signals to CD4+ T cells. These are the first data establishing that regulatory CD8+CD28- T cells occur in normal mice and play a critical role in disease resistance in CD28-/- animals.


Figures

Figure 1
Figure 1
Screening of CD28–/–CD8–/– mice by flow cytometry and PCR. A representative example of screening of CD28–/–CD8–/– mice and WT mice is shown. Cells were stained and analyzed by FACS for expression of CD8 and CD28. For the PCR screening, genomic DNA was extracted from tails of animals. In the CD8 PCR sample, homozygous samples produced a single 343-bp band, and WT mice produced a single 265-bp band. Heterozygotes produced both bands. In the CD28 PCR sample, homozygous samples produced a single 740-bp band, and WT mice produced a single 600-bp band. Heterozygous mice produced both bands. All PCR experiments included a no-template control and control reactions using DNA from known heterozygous and WT samples. Neg, negative; FL1-H, fluorescence channel 1.
Figure 2
Figure 2
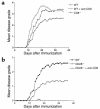
Effect of lack of CD8+ T cells on MOG p35–55–induced EAE in WT C57BL/6 and CD28–/– mice. (a) Mice were immunized with MOG p35–55 and graded for disease daily. The mean daily grade for each group is shown. This is a representative experiment showing the disease course in C57BL/6 mice treated with rat IgG (filled squares), WT mice treated with anti-CD8 mAb (open circles), and CD8–/– mice (open squares). (b) A representative experiment showing disease induction in C57BL/6 WT mice (filled squares), CD28–/– mice treated with control rat IgG (filled triangles), and CD28–/– mice treated by anti-CD8 mAb before immunization (open circles). The mean daily grade for each group (n = 5–7) is shown.
Figure 3
Figure 3
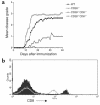
Induction of EAE in CD28–/–CD8–/– and CD28–/–CD8+/– mice. (a) Complete lack or decreased expression of CD8 molecule leads to EAE. The mean daily grade for each group (n = 8–15 mice) is on the y axis. All CD28–/–CD8–/– mice immunized with MOG developed EAE (open circles): 7 of 15 animals developed a mild form of typical EAE, while 8 of 15 animals developed an atypical form of EAE that led to death in these animals within 24 hours. CD28–/–CD8+/– mice developed mild typical EAE that was half-way between that in CD28–/– (filled triangles) and CD28–/–CD8–/– mice (open circles), indicating a dose-response effect of CD8 expression (open squares). (b) Comparison of CD8 surface expression on peripheral blood lymphocytes derived from CD28–/– mice (solid histogram) and CD28–/–CD8+/– mice (line histogram).
Figure 4
Figure 4
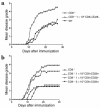
Suppression of EAE by adoptive transfer of CD8+CD28 cells into CD8–/– mice. (a) 100% purified CD8+CD28 cells were generated from naive CD28–/– splenocytes and injected into CD8–/– recipients via the tail vein, as described in Methods. The recipient mice were then immunized with MOG peptide on the same day. The mean daily score for each group (n = 10) is shown on the y axis. The course of CD8–/– mice (open squares), CD8–/– recipients of CD8+CD28 cells (open circles), and WT mice (filled squares) is shown. (b) One hundred percent purified CD8+CD28+ and CD8+CD28 T cells were isolated from spleens of naive WT mice. Approximately one million cells were then injected into each CD8–/– recipient as described above. The mean daily score for each group (n = 6) is shown on the y axis. CD8+CD28 T cells (open circles) significantly suppress the EAE as compared with the control group (open squares), while CD8+CD28+ T cells do not show any significant effect on disease course (filled circles). Adoptive transfer of approximately five million CD8+CD28 T cells did not lead to any further suppression of disease (filled squares).
Figure 5
Figure 5
H&E and LFB stains of sections of the brainstem and spinal cords from CD28–/–CD8–/– mice with typical EAE (ac) and CD28–/–CD8–/– mice with atypical EAE (df). (a) H&E-stained section from the anterior pons showing no inflammatory infiltrates. (b) LFB staining in the pons showing no demyelination. (c) LFB staining showing small infiltrate and demyelination in the lateral lumbar spinal cord (arrow). (d) H&E-stained section from pons showing inflammatory infiltrate in the anterior pons (arrow). (e) LFB staining showing demyelination in the anterior pons (arrow). (f) LFB staining showing demyelination and large inflammatory infiltrates in the lateral thoracic spinal cord (arrow). Photomicrographs af are taken at ×400 magnification. Enlargements are all at ×1,000 magnification.
Figure 6
Figure 6
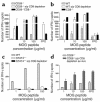
IFN-γ production of splenocytes in response to MOG peptide in vitro. MOG p35-55–specific IFN-γ–producing cells were measured by ELISPOT in cultures of splenocytes harvested on day 14 from: (a) CD28–/– mice (gray bars), CD28–/– mice depleted from CD8+ T cells in vivo by mAb (white bars) and CD28–/–CD8–/– mice (black bars). (b) WT mice (gray bars), WT mice depleted from CD8+ T cells in vivo by mAb (white bars), and CD8–/– mice (black bars). The y axis represents the number of positive cells per one million cells. Purified protein derivative (PPD) is used at a concentration of 100 μg/ml. (c) WT mice (gray bars), STAT4–/– mice (white bars), and STAT4–/–mice depleted from CD8+ T cells in vivo by mAb (black bars). (d) Expansion of IFN-γ–producing T cells after ex vivo depletion of CD8+ T cells: MOG p35-55–specific IFN-γ–producing cells were measured by ELISPOT in cultures of splenocytes harvested on day 14 from CD28–/– mice before and after CD8+ T cell depletion ex vivo by magnetic beads. The frequency of IFN-γ–producing cells is significantly higher after removal of CD8+ T cells at all concentrations of MOG or PPD (P < 0.02). s/p, status post.
Figure 7
Figure 7
CD8+CD28 T cell–induced suppression in vitro requires cell-cell contact and is APC dependent. MOG p35-55–specific IFN-γ–producing cells were measured by ELISPOT in cultures of CD8–/– on day 14 after immunization. (a) Addition of 100% purified CD8+CD28 T cells in a 2:1 ratio leads to complete suppression of IFN-γ spots only if in direct contact with responder cells (white bar), but not if separated by a Transwell membrane (black bar). Titration of the same number of CD28+/+ splenocytes as CD8+CD28 T cells only led to an increase of IFN-γ spots (dark gray bar). (b) CD8+CD28, but not CD8+CD28+ cells originating from WT mice demonstrate similar suppressive activity in vitro because CD8+CD28 cells generated from CD28–/– mice as demonstrated. (c) Purified CD8+CD28 T cells are not able to suppress IFN-γ production by 100% purified CD4 T cells stimulated by PMA (10 ng/ml) and ionomycin (400 ng/ml). The coculture of CD8+CD28 and CD4+ cells results in accumulation of spots produced by each individual group of cells (black bar) after stimulation with PMA plus ionomycin. Con A is unable to stimulate purified CD4 cells in the absence of accessory cells. (d) Purified CD8+CD28 T cells added to cultures in 2:1 contact induce complete suppression of IFN-γ production by naive CD8–/– splenocytes stimulated by Con A at 5 μg/ml.
Figure 8
Figure 8
CD8+CD28 T cells induce suppression by modification of APCs. (a) APCs incubated with CD8+CD28 T cells and Con A for at least 24 hours have significantly decreased capacity to stimulate BALB/c splenocytes (white bar) than APCs exposed to Con A and CD8+CD28+ T cells (black bar). (b) Mean decrease in percentage of APCs expressing CD40, B7-1, and B7-2 (y axis). CD11c+ cells conditioned by preculture with CD8+CD28 T cells for 24 hours in the presence of Con A were stained for expression of CD40, B7-1, and B7-2, and the percentage of positive cells was compared with CD11c+ cells precultured with CD8+CD28+ T cells. (c) Antigen-presenting capacity of APCs cocultured with CD8+CD28 T cells and MOG (white bar) as compared with that of APCs cocultured with CD8+CD28+ T cells and MOG for 24 hours (black bar). As expected, 100% purified primed CD4+ T cells are unable to respond to MOG in the absence of APCs (gray bar).

Similar articles

Cited by

References

    1. Oliveira-dos-Santos AJ, et al. CD28 costimulation is crucial for the development of spontaneous autoimmune encephalomyelitis. J. Immunol. 1999;162:4490–4495. - PubMed
    1. Perrin PJ, Lavi E, Rumbley CA, Zekavat SA, Phillips SM. Experimental autoimmune meningitis: a novel neurological disease in CD28-deficient mice. Clin. Immunol. 1999;91:41–49. - PubMed
    1. Girvin AM, et al. A critical role for B7/CD28 costimulation in experimental autoimmune encephalomyelitis: a comparative study using costimulatory molecule-deficient mice and monoclonal antibody blockade. J. Immunol. 2000;164:136–143. - PubMed
    1. Chitnis T, et al. CD28-independent induction of experimental autoimmune encephalomyelitis. J. Clin. Invest. 2001;107:575–583. - PMC - PubMed
    1. Karpus WJ, et al. An important role for the chemokine macrophage inflammatory protein-1 alpha in the pathogenesis of the T cell-mediated autoimmune disease, experimental autoimmune encephalomyelitis. J. Immunol. 1995;155:5003–5010. - PubMed

Publication types

MeSH terms