

Reversible and fast association equilibria of a molecular chaperone, gp57A, of bacteriophage T4
- PMID: 14507723
- PMCID: PMC1303484
- DOI: 10.1016/s0006-3495(03)74683-9
Reversible and fast association equilibria of a molecular chaperone, gp57A, of bacteriophage T4
Abstract
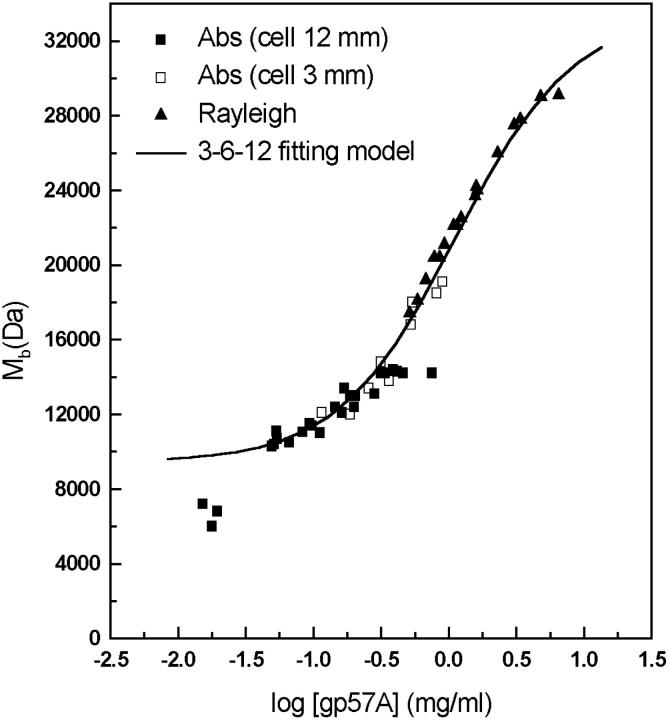
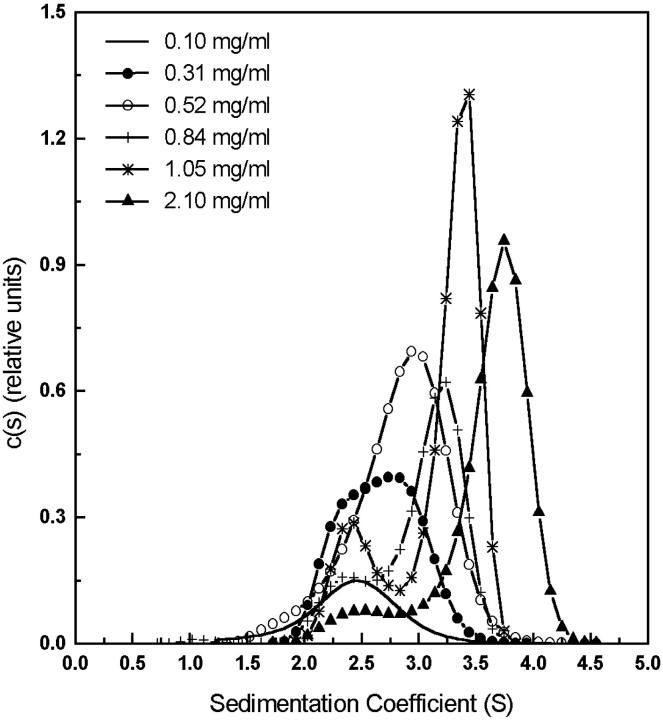
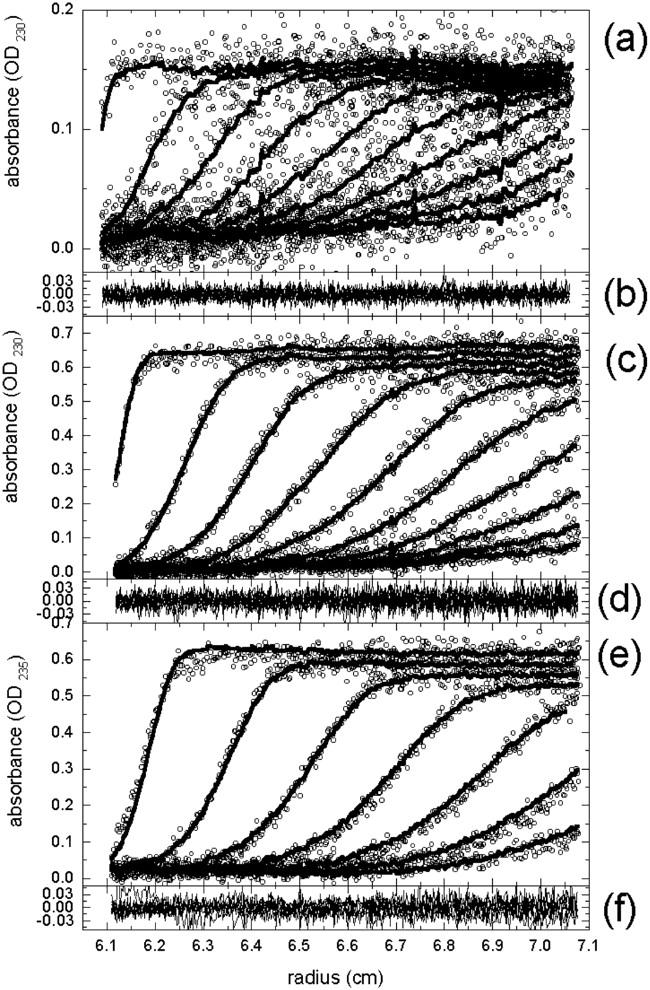
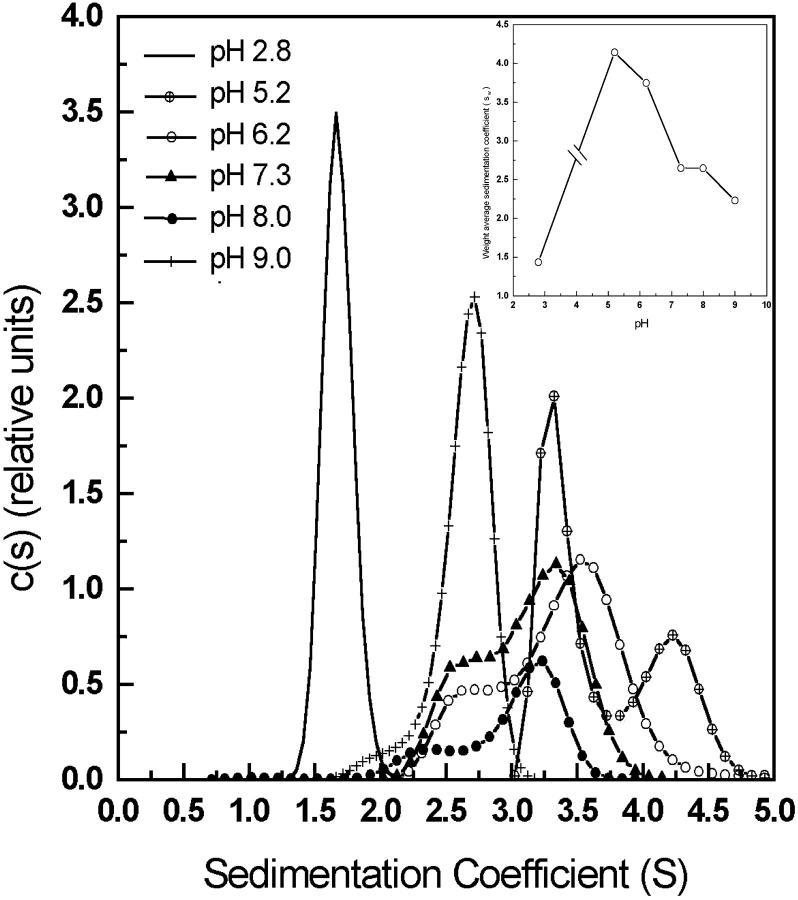
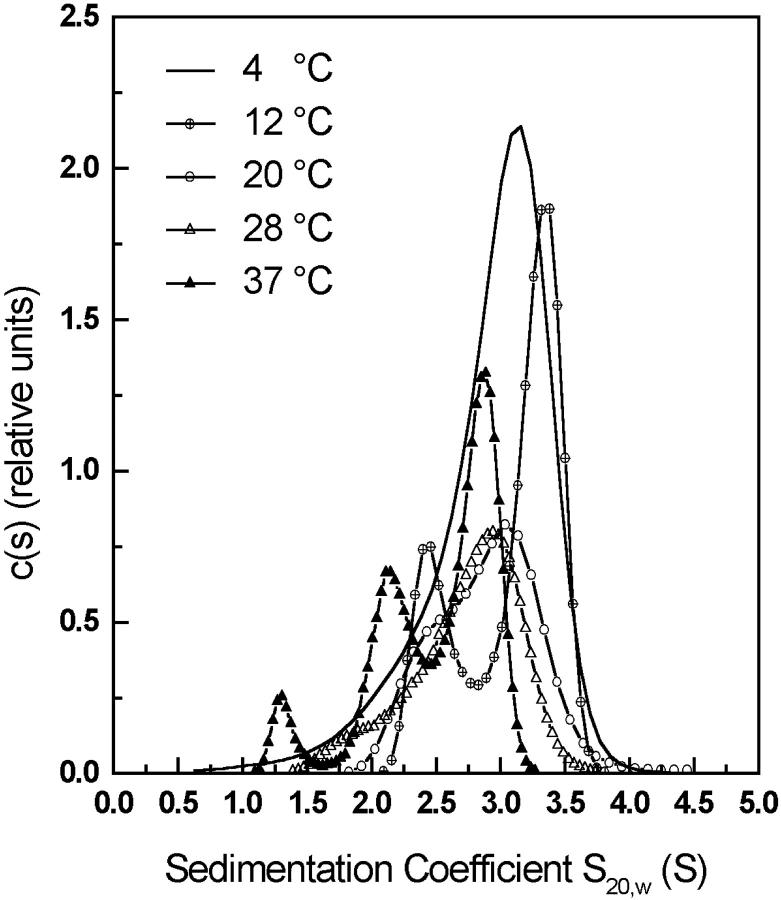
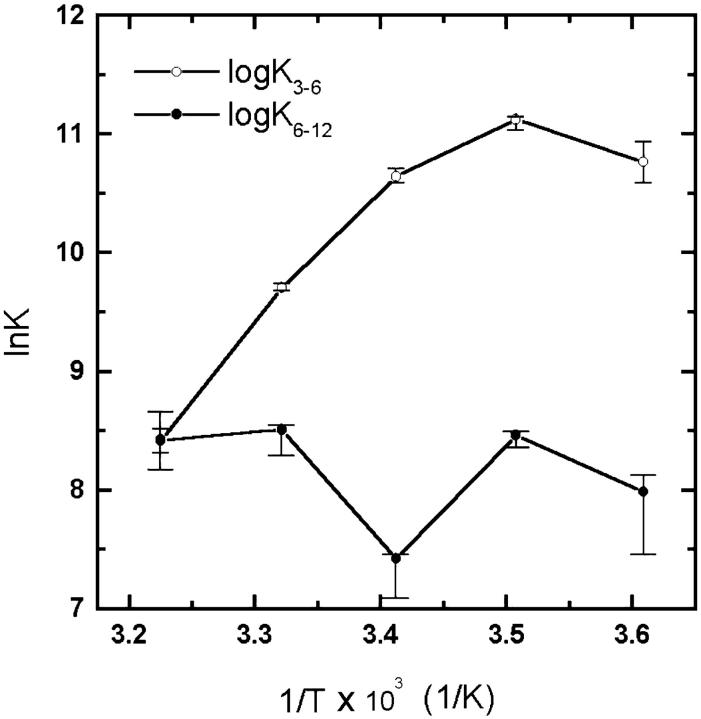
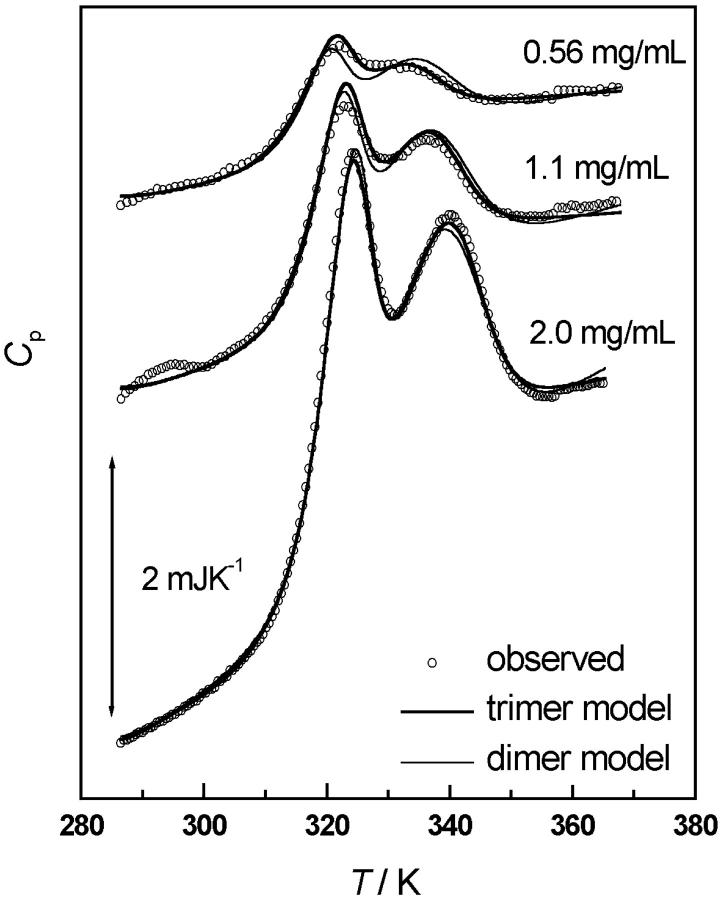
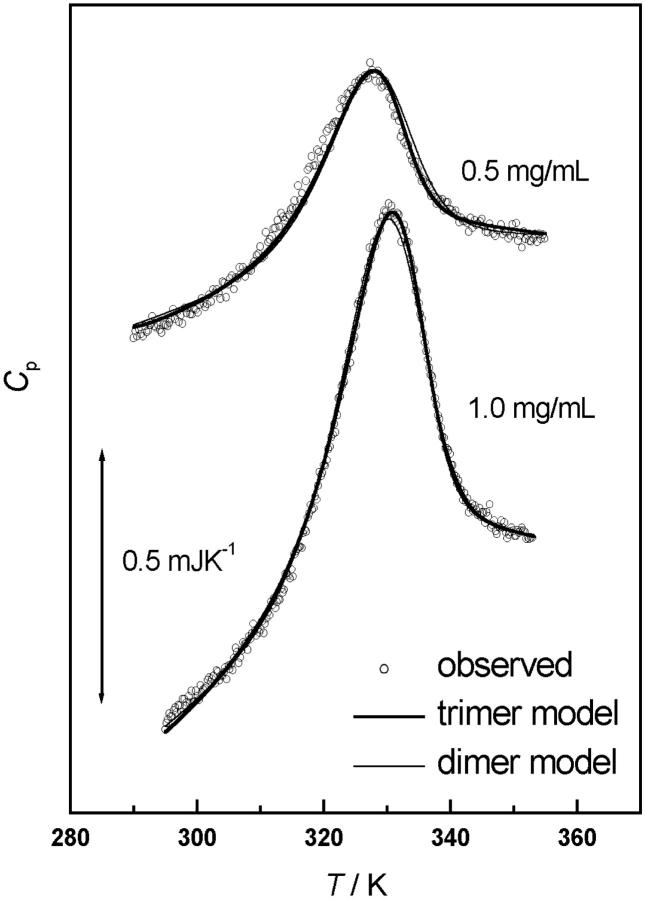
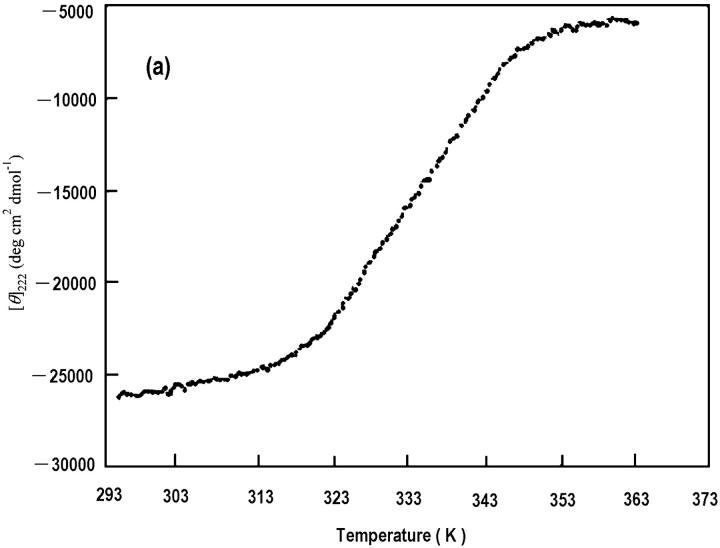
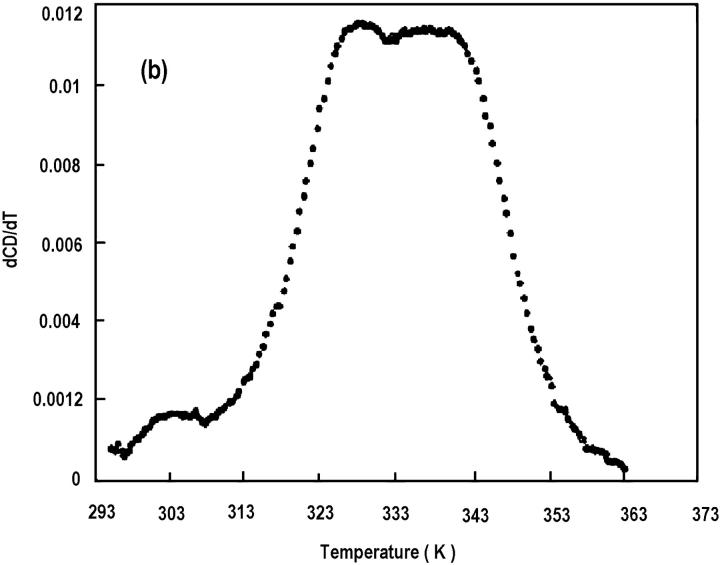
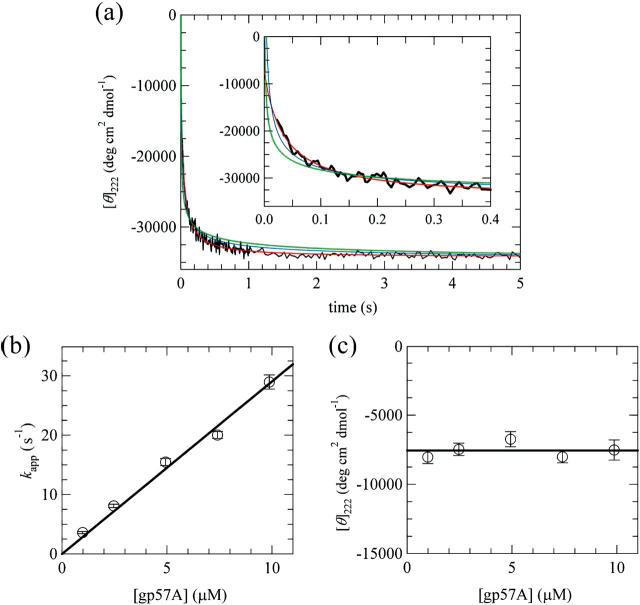
The association of a molecular chaperone, gp57A, of bacteriophage T4, which facilitates formation of the long and short tail fibers, was investigated by analytical ultracentrifugation, differential scanning microcalorimetry, and stopped-flow circular dichroism (CD) to establish the association scheme of the protein. Gp57A is an oligomeric alpha-helix protein with 79 amino acids. Analysis of the sedimentation velocity data by direct boundary modeling with Lamm equation solutions together with a more detailed boundary analysis incorporating association schemes led us to conclude that at least three oligomeric species of gp57A are in reversible and fast association equilibria and that a 3(mer)-6(mer)-12(mer) model described the data best. On the other hand, differential scanning microcalorimetry revealed a highly reversible two-step transition of dissociation/denaturation, both of which accompanied decrease in CD at 222 nm. The melting curve analysis revealed that it is consistent with a 6(mer)-3(mer)-1(mer) model. The refolding/association kinetics of gp57A measured by stopped-flow CD was consistent with the interpretation that the bimolecular reaction from trimer to hexamer was preceded by a fast alpha-helix formation in the dead-time. Trimer or hexamer is likely the functional oligomeric state of gp57A.
Figures
Similar articles
-
Isolation and characterization of a molecular chaperone, gp57A, of bacteriophage T4.J Bacteriol. 1997 Mar;179(6):1846-51. doi: 10.1128/jb.179.6.1846-1851.1997. J Bacteriol. 1997. PMID: 9068627 Free PMC article.
-
Kinetics and motional dynamics of spin-labeled yeast iso-1-cytochrome c: 1. Stopped-flow electron paramagnetic resonance as a probe for protein folding/unfolding of the C-terminal helix spin-labeled at cysteine 102.Biochemistry. 1997 Mar 11;36(10):2884-97. doi: 10.1021/bi962155i. Biochemistry. 1997. PMID: 9062118
-
Dimer structure as a minimum cooperative subunit of small heat-shock proteins.Biochim Biophys Acta. 1995 Dec 6;1253(2):163-8. doi: 10.1016/0167-4838(95)00135-x. Biochim Biophys Acta. 1995. PMID: 8519797
-
Conformational states bound by the molecular chaperones GroEL and secB: a hidden unfolding (annealing) activity.J Mol Biol. 1996 Aug 9;261(1):43-61. doi: 10.1006/jmbi.1996.0440. J Mol Biol. 1996. PMID: 8760501
-
Chaperones in bacteriophage T4 assembly.Biochemistry (Mosc). 1998 Apr;63(4):399-406. Biochemistry (Mosc). 1998. PMID: 9556522 Review.
Cited by
-
A mutation in the S6 segment of the KvAP channel changes the secondary structure and alters ion channel activity in a lipid bilayer membrane.Amino Acids. 2022 Nov;54(11):1461-1475. doi: 10.1007/s00726-022-03188-8. Epub 2022 Jul 27. Amino Acids. 2022. PMID: 35896819
-
The analysis of macromolecular interactions by sedimentation equilibrium.Methods. 2011 May;54(1):145-56. doi: 10.1016/j.ymeth.2010.12.005. Epub 2010 Dec 16. Methods. 2011. PMID: 21167941 Free PMC article.
-
Crystal Structure of the Carboxy-Terminal Region of the Bacteriophage T4 Proximal Long Tail Fiber Protein Gp34.Viruses. 2017 Jun 30;9(7):168. doi: 10.3390/v9070168. Viruses. 2017. PMID: 28665339 Free PMC article.
-
The N-terminal octapeptide acts as a dimerization inhibitor of SARS coronavirus 3C-like proteinase.Biochem Biophys Res Commun. 2006 Jan 20;339(3):865-72. doi: 10.1016/j.bbrc.2005.11.102. Epub 2005 Nov 28. Biochem Biophys Res Commun. 2006. PMID: 16329994 Free PMC article.
-
Crystallization of the carboxy-terminal region of the bacteriophage T4 proximal long tail fibre protein gp34.Acta Crystallogr F Struct Biol Commun. 2014 Jul;70(Pt 7):970-5. doi: 10.1107/S2053230X14010449. Epub 2014 Jun 19. Acta Crystallogr F Struct Biol Commun. 2014. PMID: 25005101 Free PMC article.
References
-
- Arai, M., and K. Kuwajima. 1996. Rapid formation of a molten globule intermediate in refolding of α-lactalbumin. Fold. Des. 1:275–287. - PubMed
-
- Bishop, J. R., M. P. Conley, and W. B. Wood. 1974. Assembly and attachment of bacteriophage T4 tail fibers. J. Supramol. Struct. 2:196–201. - PubMed
-
- Burda, M. R., and S. Miller. 1999. Folding of coliphage T4 short tail fiber in vitro. Analysing the role of a bacteriophage-encoded chaperone. Eur. J. Biochem. 265:771–778. - PubMed
-
- Cox, D. J. 1969. Computer simulation of sedimentation in the ultracentrifuge. IV. Velocity sedimentation of self-associating solutes. Arch. Biochem. Biophys. 129:106–123. - PubMed
-
- Dam, J., and P. Schuck. 2003. Calculating sedimentation coefficient distributions by direct modeling of sedimentation velocity data. Methods Enzymol. In press. - PubMed
Publication types
MeSH terms
Substances
LinkOut - more resources
Full Text Sources
Miscellaneous
