

Sphingomyelin/phosphatidylcholine/cholesterol phase diagram: boundaries and composition of lipid rafts
- PMID: 14507704
- PMCID: PMC1303465
- DOI: 10.1016/S0006-3495(03)74664-5
Sphingomyelin/phosphatidylcholine/cholesterol phase diagram: boundaries and composition of lipid rafts
Abstract
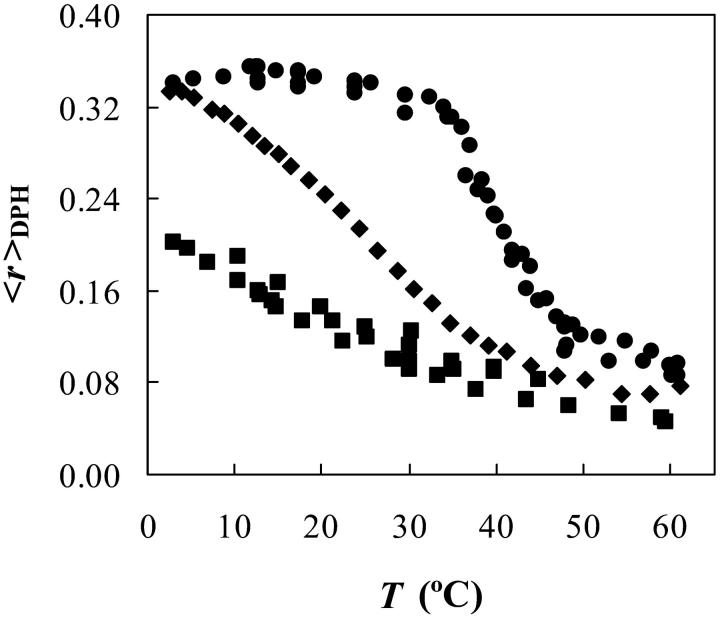
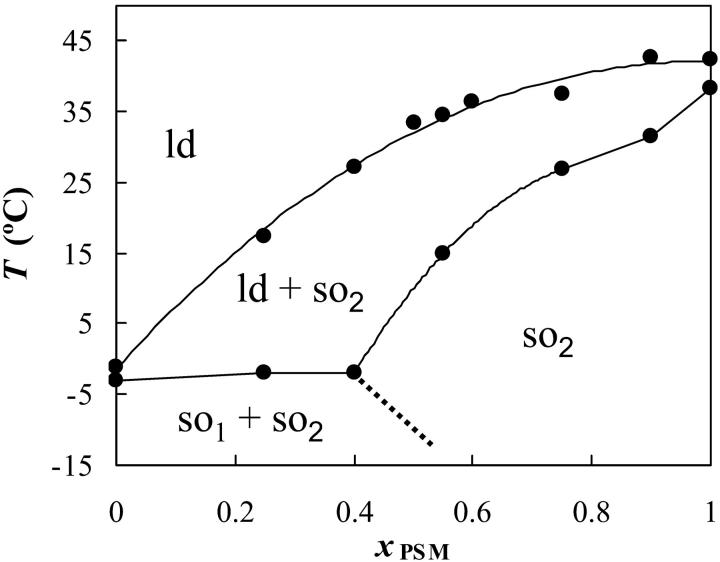
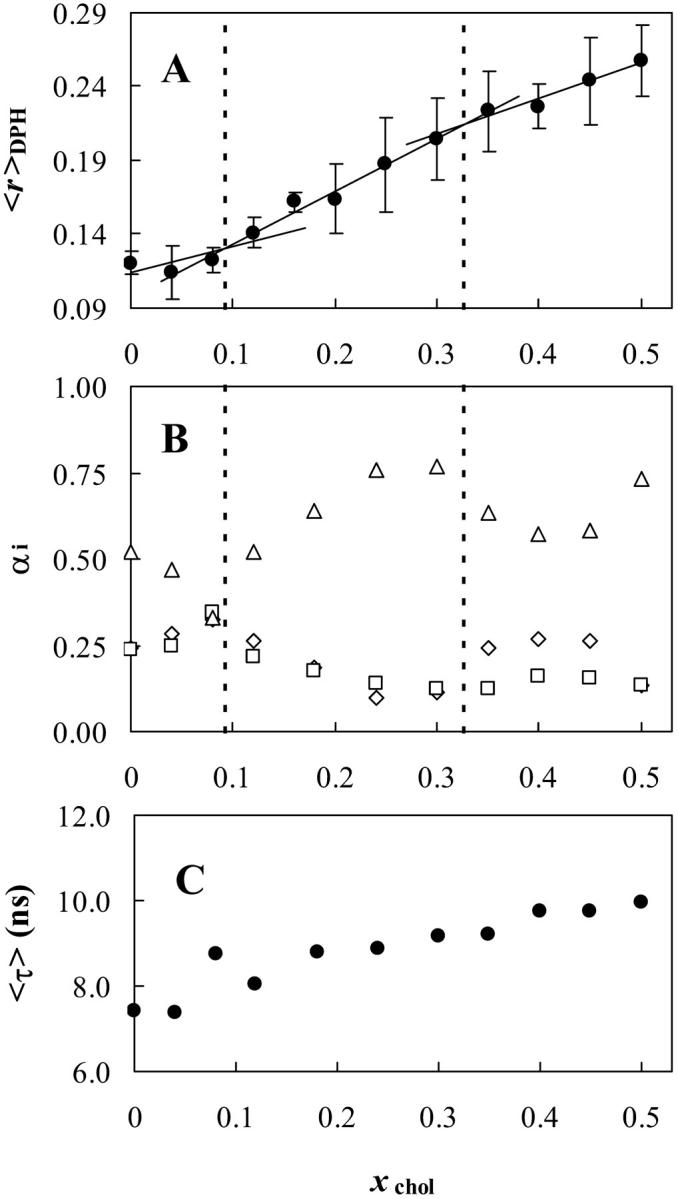
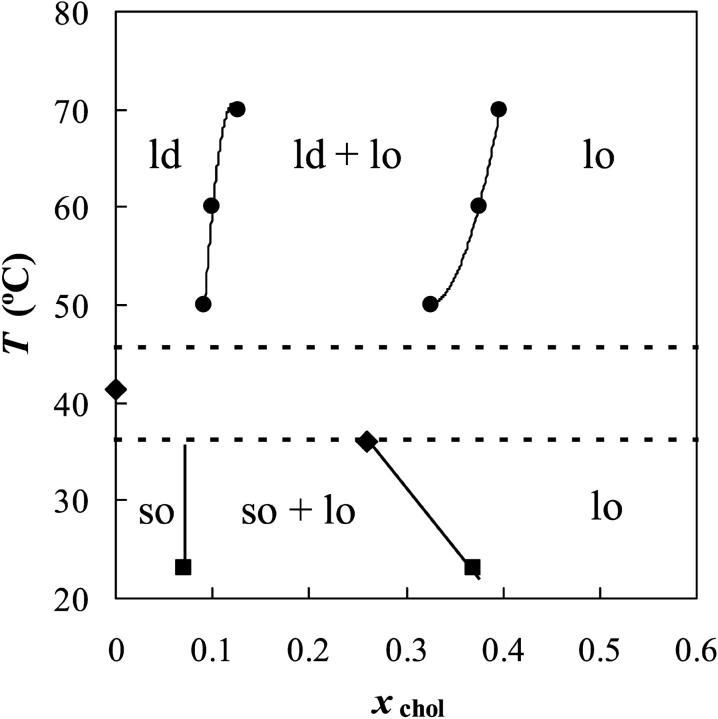
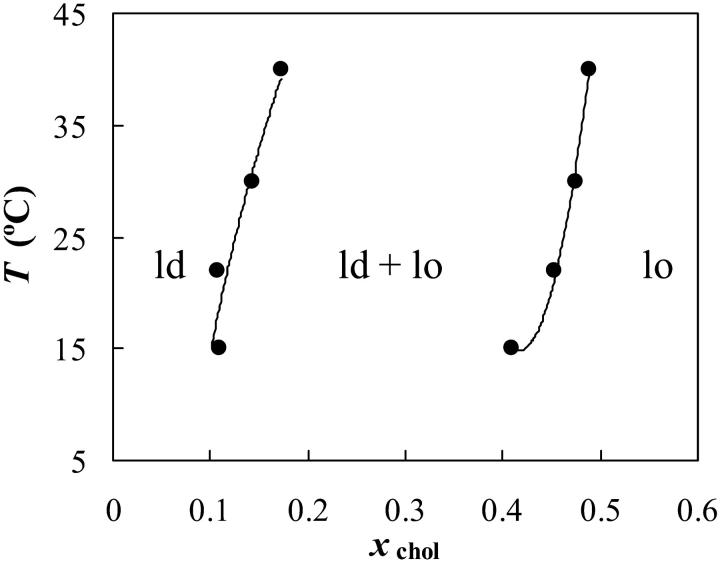
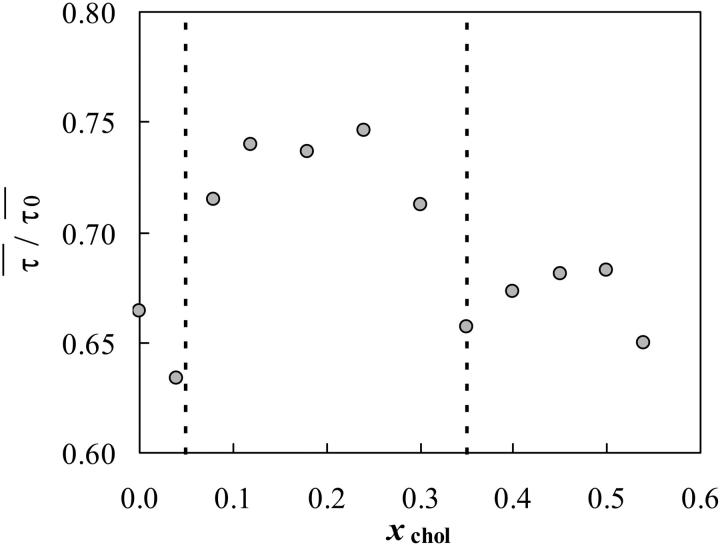
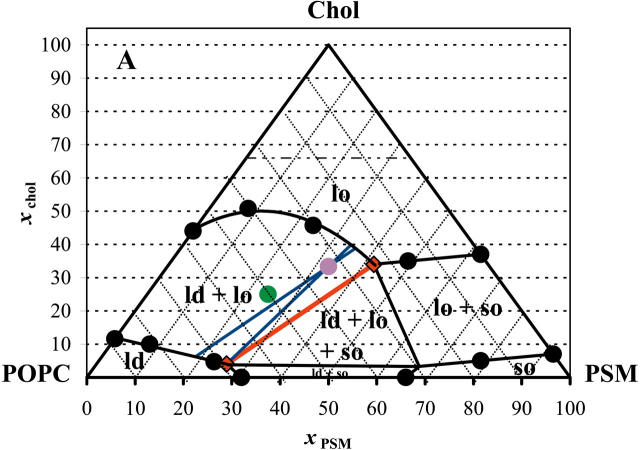
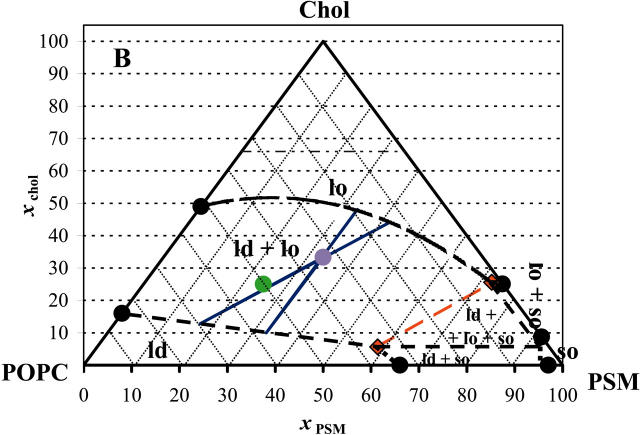
The ternary system palmitoylsphingomyelin (PSM)/palmitoyloleoylphosphatidylcholine (POPC)/cholesterol is used to model lipid rafts. The phase behavior of the three binary systems PSM/POPC, PSM/cholesterol, and POPC/cholesterol is first experimentally determined. Phase coexistence boundaries are then determined for ternary mixtures at room temperature (23 degrees C) and the ternary phase diagram at that temperature is obtained. From the diagram at 23 degrees C and the binary phase diagrams, a reasonable expectation is drawn for the ternary phase diagram at 37 degrees C. Several photophysical methodologies are employed that do not involve detergent extraction, in addition to literature data (e.g., differential scanning calorimetry) and thermodynamic rules. For the ternary phase diagrams, some tie-lines are calculated, including the one that contains the PSM/POPC/ cholesterol 1:1:1 mixture, which is often used in model raft studies. The diagrams here described are used to rationalize literature results, some of them apparently discrepant, and to discuss lipid rafts within the framework of liquid-ordered/liquid-disordered phase coexistence.
Figures
Similar articles
-
Characterization of the ternary mixture of sphingomyelin, POPC, and cholesterol: support for an inhomogeneous lipid distribution at high temperatures.Biophys J. 2008 Apr 1;94(7):2680-90. doi: 10.1529/biophysj.107.112904. Epub 2008 Jan 4. Biophys J. 2008. PMID: 18178660 Free PMC article.
-
Phase diagram of ternary cholesterol/palmitoylsphingomyelin/palmitoyloleoyl-phosphatidylcholine mixtures: spin-label EPR study of lipid-raft formation.Biophys J. 2012 Apr 18;102(8):1856-65. doi: 10.1016/j.bpj.2012.03.043. Biophys J. 2012. PMID: 22768941 Free PMC article.
-
Phase diagrams of lipid mixtures relevant to the study of membrane rafts.Biochim Biophys Acta. 2008 Nov-Dec;1781(11-12):665-84. doi: 10.1016/j.bbalip.2008.09.002. Epub 2008 Oct 7. Biochim Biophys Acta. 2008. PMID: 18952002 Free PMC article. Review.
-
Phase diagram of a polyunsaturated lipid mixture: Brain sphingomyelin/1-stearoyl-2-docosahexaenoyl-sn-glycero-3-phosphocholine/cholesterol.Biochim Biophys Acta. 2016 Jan;1858(1):153-61. doi: 10.1016/j.bbamem.2015.10.016. Epub 2015 Oct 23. Biochim Biophys Acta. 2016. PMID: 26525664 Free PMC article.
-
The state of lipid rafts: from model membranes to cells.Annu Rev Biophys Biomol Struct. 2003;32:257-83. doi: 10.1146/annurev.biophys.32.110601.142439. Epub 2003 Jan 16. Annu Rev Biophys Biomol Struct. 2003. PMID: 12543707 Review.
Cited by
-
The Impact of N-terminal Acetylation of α-Synuclein on Phospholipid Membrane Binding and Fibril Structure.J Biol Chem. 2016 Sep 30;291(40):21110-21122. doi: 10.1074/jbc.M116.726612. Epub 2016 Aug 16. J Biol Chem. 2016. PMID: 27531743 Free PMC article.
-
Effects of sphingomyelin headgroup size on interactions with ceramide.Biophys J. 2013 Feb 5;104(3):604-12. doi: 10.1016/j.bpj.2012.12.026. Biophys J. 2013. PMID: 23442911 Free PMC article.
-
Lipid Interactions and Organization in Complex Bilayer Membranes.Biophys J. 2016 Apr 12;110(7):1563-1573. doi: 10.1016/j.bpj.2015.12.043. Biophys J. 2016. PMID: 27074681 Free PMC article.
-
Receptor-independent interaction of bacterial lipopolysaccharide with lipid and lymphocyte membranes; the role of cholesterol.PLoS One. 2012;7(6):e38677. doi: 10.1371/journal.pone.0038677. Epub 2012 Jun 7. PLoS One. 2012. PMID: 22685597 Free PMC article.
-
Lipid raft components cholesterol and sphingomyelin increase H+/OH- permeability of phosphatidylcholine membranes.Biochem J. 2006 Sep 15;398(3):485-95. doi: 10.1042/BJ20051620. Biochem J. 2006. PMID: 16706750 Free PMC article.
References
-
- Ahmed, S. N., D. A. Brown, and E. London. 1997. On the origin of sphingolipid/cholesterol-rich detergent-insoluble cell membranes: physiological concentrations of cholesterol and sphingolipid induce formation of a detergent-insoluble, liquid-ordered lipid phase in model membranes. Biochemistry. 36:10944–10953. - PubMed
-
- Almeida, P. F. F., W. L. C. Vaz, and T. E. Thompson. 1992. Lateral diffusion in the liquid phases of dimyristoylphosphatidylcholine/cholesterol lipid bilayers: a free volume analysis. Biochemistry. 31:6739–6747. - PubMed
-
- Anderson, R. G. W., and K. Jacobson. 2002. A role for lipid shells in targeting proteins to caveolae, rafts and other lipid domains. Science. 296:1821–1825. - PubMed
-
- Barenholz, Y., J. Suurkuusk, D. Mountcastle, T. E. Thompson, and R. L. Biltonen. 1976. A calorimetric study of the thermotropic behavior of aqueous dispersions of natural and synthetic sphingomyelins. Biochemistry. 15:2441–2447. - PubMed
-
- Brown, D. A., and E. London. 1997. Structure of detergent-resistant membrane domains: does phase separation occur in biological membranes? Biochem. Biophys. Res. Commun. 240:1–7. - PubMed
Publication types
MeSH terms
Substances
LinkOut - more resources
Full Text Sources
Other Literature Sources
Medical
Miscellaneous
