Statistical density modification using local pattern matching
- PMID: 14501107
- PMCID: PMC2745877
- DOI: 10.1107/s0907444903015142
Statistical density modification using local pattern matching
Abstract
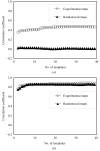
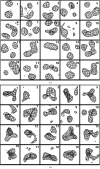
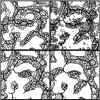
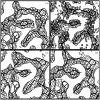
A method for improving crystallographic phases is presented that is based on the preferential occurrence of certain local patterns of electron density in macromolecular electron-density maps. The method focuses on the relationship between the value of electron density at a point in the map and the pattern of density surrounding this point. Patterns of density that can be superimposed by rotation about the central point are considered equivalent. Standard templates are created from experimental or model electron-density maps by clustering and averaging local patterns of electron density. The clustering is based on correlation coefficients after rotation to maximize the correlation. Experimental or model maps are also used to create histograms relating the value of electron density at the central point to the correlation coefficient of the density surrounding this point with each member of the set of standard patterns. These histograms are then used to estimate the electron density at each point in a new experimental electron-density map using the pattern of electron density at points surrounding that point and the correlation coefficient of this density to each of the set of standard templates, again after rotation to maximize the correlation. The method is strengthened by excluding any information from the point in question from both the templates and the local pattern of density in the calculation. A function based on the origin of the Patterson function is used to remove information about the electron density at the point in question from nearby electron density. This allows an estimation of the electron density at each point in a map, using only information from other points in the process. The resulting estimates of electron density are shown to have errors that are nearly independent of the errors in the original map using model data and templates calculated at a resolution of 2.6 A. Owing to this independence of errors, information from the new map can be combined in a simple fashion with information from the original map to create an improved map. An iterative phase-improvement process using this approach and other applications of the image-reconstruction method are described and applied to experimental data at resolutions ranging from 2.4 to 2.8 A.
Figures


Similar articles
-
Imaging RNA and dynamic protein segments with low-resolution virus crystallography: experimental design, data processing and implications of electron density maps.J Mol Biol. 1998 Dec 18;284(5):1439-52. doi: 10.1006/jmbi.1998.2231. J Mol Biol. 1998. PMID: 9878362
-
Wavelet analysis of electron-density maps.Acta Crystallogr D Biol Crystallogr. 2000 May;56(Pt 5):618-24. doi: 10.1107/s0907444900003115. Acta Crystallogr D Biol Crystallogr. 2000. PMID: 10771431
-
Map-likelihood phasing.Acta Crystallogr D Biol Crystallogr. 2001 Dec;57(Pt 12):1763-75. doi: 10.1107/s0907444901013749. Epub 2001 Nov 21. Acta Crystallogr D Biol Crystallogr. 2001. PMID: 11717488 Free PMC article.
-
Ab initio phase determination and phase extension using non-crystallographic symmetry.Curr Opin Struct Biol. 1995 Oct;5(5):650-5. doi: 10.1016/0959-440x(95)80058-1. Curr Opin Struct Biol. 1995. PMID: 8574701 Review.
-
From electron density and sequence to structure: integrating protein image analysis and threading for structure determination.Proc Int Conf Intell Syst Mol Biol. 1996;4:25-33. Proc Int Conf Intell Syst Mol Biol. 1996. PMID: 8877501 Review.
Cited by
-
Crystal structure of an intermediate of rotating dimers within the synaptic tetramer of the G-segment invertase.Nucleic Acids Res. 2013 Feb 1;41(4):2673-82. doi: 10.1093/nar/gks1303. Epub 2012 Dec 28. Nucleic Acids Res. 2013. PMID: 23275567 Free PMC article.
-
Structural basis of severe acute respiratory syndrome coronavirus ADP-ribose-1''-phosphate dephosphorylation by a conserved domain of nsP3.Structure. 2005 Nov;13(11):1665-75. doi: 10.1016/j.str.2005.07.022. Structure. 2005. PMID: 16271890 Free PMC article.
-
Iterative model building, structure refinement and density modification with the PHENIX AutoBuild wizard.Acta Crystallogr D Biol Crystallogr. 2008 Jan;64(Pt 1):61-9. doi: 10.1107/S090744490705024X. Epub 2007 Dec 5. Acta Crystallogr D Biol Crystallogr. 2008. PMID: 18094468 Free PMC article.
-
Structure and sequence analyses of Bacteroides proteins BVU_4064 and BF1687 reveal presence of two novel predominantly-beta domains, predicted to be involved in lipid and cell surface interactions.BMC Bioinformatics. 2015 Jan 16;16(1):7. doi: 10.1186/s12859-014-0434-7. BMC Bioinformatics. 2015. PMID: 25592227 Free PMC article.
-
Crystal structure of Mil (Mth680): internal duplication and similarity between the Imp4/Brix domain and the anticodon-binding domain of class IIa aminoacyl-tRNA synthetases.EMBO Rep. 2005 Feb;6(2):140-6. doi: 10.1038/sj.embor.7400328. EMBO Rep. 2005. PMID: 15654320 Free PMC article.
References
Publication types
MeSH terms
Substances
LinkOut - more resources
Full Text Sources

