

Gene expression patterns in ovarian carcinomas
- PMID: 12960427
- PMCID: PMC266758
- DOI: 10.1091/mbc.e03-05-0279
Gene expression patterns in ovarian carcinomas
Abstract
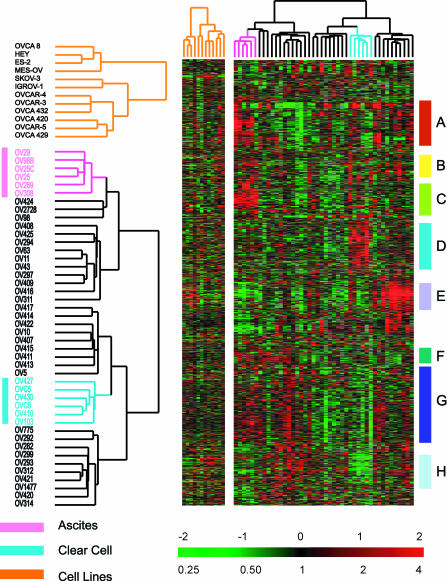
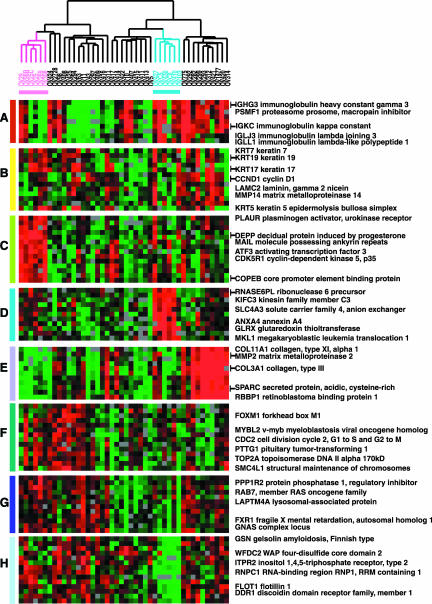
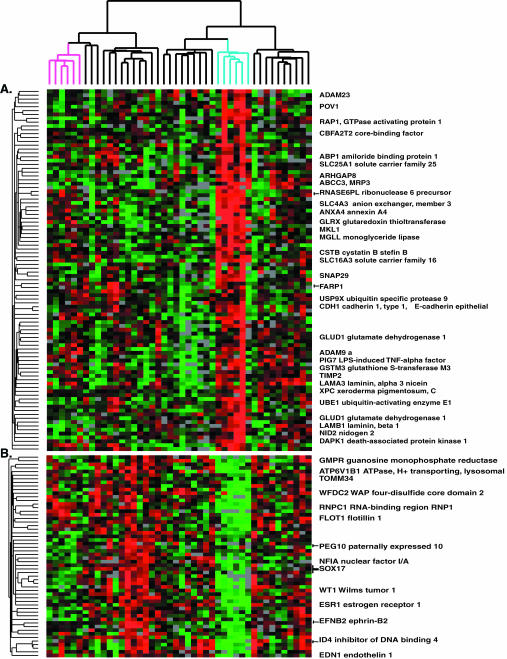
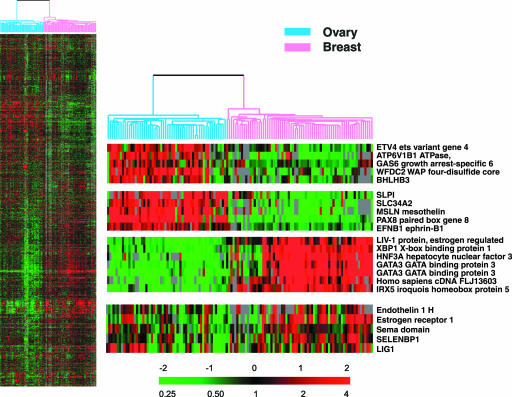
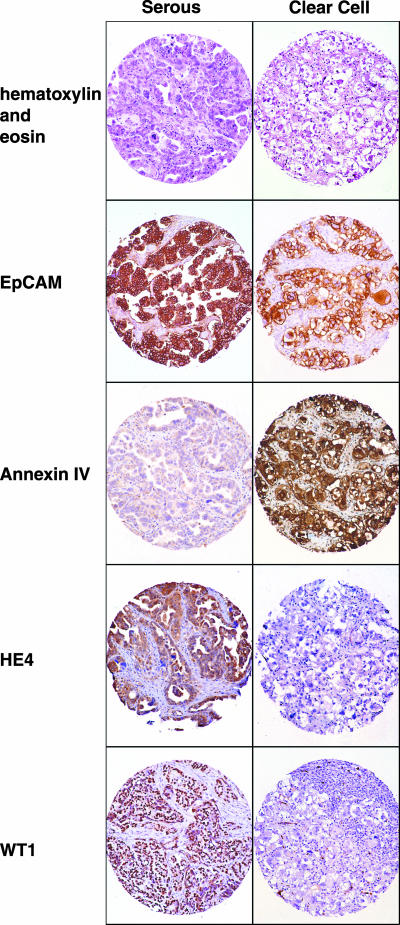
We used DNA microarrays to characterize the global gene expression patterns in surface epithelial cancers of the ovary. We identified groups of genes that distinguished the clear cell subtype from other ovarian carcinomas, grade I and II from grade III serous papillary carcinomas, and ovarian from breast carcinomas. Six clear cell carcinomas were distinguished from 36 other ovarian carcinomas (predominantly serous papillary) based on their gene expression patterns. The differences may yield insights into the worse prognosis and therapeutic resistance associated with clear cell carcinomas. A comparison of the gene expression patterns in the ovarian cancers to published data of gene expression in breast cancers revealed a large number of differentially expressed genes. We identified a group of 62 genes that correctly classified all 125 breast and ovarian cancer specimens. Among the best discriminators more highly expressed in the ovarian carcinomas were PAX8 (paired box gene 8), mesothelin, and ephrin-B1 (EFNB1). Although estrogen receptor was expressed in both the ovarian and breast cancers, genes that are coregulated with the estrogen receptor in breast cancers, including GATA-3, LIV-1, and X-box binding protein 1, did not show a similar pattern of coexpression in the ovarian cancers.
Figures
Similar articles
-
Snail, Slug, and Smad-interacting protein 1 as novel parameters of disease aggressiveness in metastatic ovarian and breast carcinoma.Cancer. 2005 Apr 15;103(8):1631-43. doi: 10.1002/cncr.20946. Cancer. 2005. PMID: 15742334
-
Simultaneous carcinomas of the breast and ovary: utility of Pax-8, WT-1, and GATA3 for distinguishing independent primary tumors from metastases.Int J Gynecol Pathol. 2015 May;34(3):257-65. doi: 10.1097/PGP.0000000000000155. Int J Gynecol Pathol. 2015. PMID: 25844549
-
Comprehensive analysis of 20q13 genes in ovarian cancer identifies ADRM1 as amplification target.Genes Chromosomes Cancer. 2008 Oct;47(10):873-83. doi: 10.1002/gcc.20592. Genes Chromosomes Cancer. 2008. PMID: 18615678
-
The molecular basis of thyroid epithelial tumorigenesis.Tumori. 2003 Sep-Oct;89(5):514-6. doi: 10.1177/030089160308900510. Tumori. 2003. PMID: 14870774 Review.
-
Molecular profiling of breast cancer: portraits but not physiognomy.Breast Cancer Res. 2001;3(2):77-80. doi: 10.1186/bcr274. Epub 2000 Dec 18. Breast Cancer Res. 2001. PMID: 11250749 Free PMC article. Review.
Cited by
-
Dyskerin overexpression in human hepatocellular carcinoma is associated with advanced clinical stage and poor patient prognosis.PLoS One. 2012;7(8):e43147. doi: 10.1371/journal.pone.0043147. Epub 2012 Aug 13. PLoS One. 2012. PMID: 22912812 Free PMC article.
-
Methylation and expression of PTPN22 in esophageal squamous cell carcinoma.Oncotarget. 2016 Sep 27;7(39):64043-64052. doi: 10.18632/oncotarget.11581. Oncotarget. 2016. PMID: 27613842 Free PMC article.
-
Let-7 expression defines two differentiation stages of cancer.Proc Natl Acad Sci U S A. 2007 Jul 3;104(27):11400-5. doi: 10.1073/pnas.0704372104. Epub 2007 Jun 28. Proc Natl Acad Sci U S A. 2007. PMID: 17600087 Free PMC article.
-
An integrative model for recurrence in ovarian cancer.Mol Cancer. 2008 Jan 22;7:8. doi: 10.1186/1476-4598-7-8. Mol Cancer. 2008. PMID: 18211683 Free PMC article. No abstract available.
-
Comprehensive analysis of the value of RAB family genes in prognosis of breast invasive carcinoma.Biosci Rep. 2020 May 29;40(5):BSR20201103. doi: 10.1042/BSR20201103. Biosci Rep. 2020. PMID: 32432324 Free PMC article.
References
-
- Alizadeh, A., Eisen, M., Botstein, D., Brown, P.O., and Staudt, L.M. (1998). Probing lymphocyte biology by genomic-scale gene expression analysis. J. Clin. Immunol. 18, 373-379. - PubMed
-
- Alizadeh, A.A. et al. (2000). Distinct types of diffuse large B-cell lymphoma identified by gene expression profiling. Nature 403, 503-511. - PubMed
-
- Altaras, M.M., Aviram, R., Cohen, I., Cordoba, M., Weiss, E., and Beyth, Y. (1991). Primary peritoneal papillary serous adenocarcinoma: clinical and management aspects. Gynecol. Oncol. 40, 230-236. - PubMed
-
- Arner, E.S., Nakamura, H., Sasada, T., Yodoi, J., Holmgren, A., and Spyrou, G. (2001). Analysis of the inhibition of mammalian thioredoxin, thioredoxin reductase, and glutaredoxin by cis-diamminedichloroplatinum (II) and its major metabolite, the glutathione-platinum complex. Free Radic. Biol. Med. 31, 1170-1178. - PubMed
Publication types
MeSH terms
Substances
Grants and funding
LinkOut - more resources
Full Text Sources
Other Literature Sources
Medical
Molecular Biology Databases
Research Materials
Miscellaneous
