Translational hydration water dynamics drives the protein glass transition
- PMID: 12944299
- PMCID: PMC1303358
- DOI: 10.1016/S0006-3495(03)74614-1
Translational hydration water dynamics drives the protein glass transition
Abstract
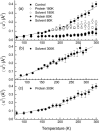
Experimental and computer simulation studies have revealed the presence of a glass-like transition in the internal dynamics of hydrated proteins at approximately 200 K involving an increase of the amplitude of anharmonic dynamics. This increase in flexibility has been correlated with the onset of protein activity. Here, we determine the driving force behind the protein transition by performing molecular dynamics simulations of myoglobin surrounded by a shell of water. A dual heat bath method is used with which, in any given simulation, the protein and solvent are held at different temperatures, and sets of simulations are performed varying the temperature of the components. The results show that the protein transition is driven by a dynamical transition in the hydration water that induces increased fluctuations primarily in side chains in the external regions of the protein. The water transition involves activation of translational diffusion and occurs even in simulations where the protein atoms are held fixed.
Figures


Similar articles
-
The protein-solvent glass transition.Biochim Biophys Acta. 2010 Jan;1804(1):3-14. doi: 10.1016/j.bbapap.2009.06.019. Epub 2009 Jul 3. Biochim Biophys Acta. 2010. PMID: 19577666 Review.
-
Temperature dependence of dynamics of hydrated myoglobin. Comparison of force field calculations with neutron scattering data.J Mol Biol. 1990 Oct 5;215(3):439-55. doi: 10.1016/s0022-2836(05)80363-8. J Mol Biol. 1990. PMID: 2231714
-
Protein hydration elucidated by molecular dynamics simulation.Proc Natl Acad Sci U S A. 1993 Oct 1;90(19):9135-9. doi: 10.1073/pnas.90.19.9135. Proc Natl Acad Sci U S A. 1993. PMID: 8415667 Free PMC article.
-
Hydration dependence of myoglobin dynamics studied with elastic neutron scattering, differential scanning calorimetry and broadband dielectric spectroscopy.Biophys Chem. 2014 Jan;185:25-31. doi: 10.1016/j.bpc.2013.11.004. Epub 2013 Nov 16. Biophys Chem. 2014. PMID: 24309207
-
Structure and dynamics of the water around myoglobin.Protein Sci. 1995 Feb;4(2):149-58. doi: 10.1002/pro.5560040202. Protein Sci. 1995. PMID: 7757005 Free PMC article. Review.
Cited by
-
Influence of water clustering on the dynamics of hydration water at the surface of a lysozyme.Biophys J. 2007 Nov 1;93(9):2986-3000. doi: 10.1529/biophysj.107.108753. Epub 2007 Jul 13. Biophys J. 2007. PMID: 17631539 Free PMC article.
-
Hydration effect on low-frequency protein dynamics observed in simulated neutron scattering spectra.Biophys J. 2008 Jun;94(11):4435-43. doi: 10.1529/biophysj.107.118042. Epub 2008 Feb 29. Biophys J. 2008. PMID: 18310244 Free PMC article.
-
Distinct Protein Hydration Water Species Defined by Spatially Resolved Spectra of Intermolecular Vibrations.J Phys Chem B. 2017 Aug 10;121(31):7431-7442. doi: 10.1021/acs.jpcb.7b03966. Epub 2017 Jul 11. J Phys Chem B. 2017. PMID: 28636363 Free PMC article.
-
Translational diffusion of hydration water correlates with functional motions in folded and intrinsically disordered proteins.Nat Commun. 2015 Mar 16;6:6490. doi: 10.1038/ncomms7490. Nat Commun. 2015. PMID: 25774711 Free PMC article.
-
Protein dynamical transition at 110 K.Proc Natl Acad Sci U S A. 2011 Dec 27;108(52):20897-901. doi: 10.1073/pnas.1110840108. Epub 2011 Dec 13. Proc Natl Acad Sci U S A. 2011. PMID: 22167801 Free PMC article.
References
-
- Angell, C. A. 1995. Formation of glasses from liquids and biopolymers. Science. 267:1924–1935. - PubMed
-
- Bizzarri, A. R., A. Paciaroni, and S. Cannistraro. 2000. Glasslike dynamical behavior of the plastocyanin hydration water. Phys. Rev. E. 62:3991–3999. - PubMed
-
- Brooks, B. R., R. E. Bruccoleri, B. D. Olafson, D. J. States, S. Swaminathan, and M. Karplus. 1983. CHARMM: a program for macromolecular energy, minimization and dynamics calculations. J. Comput. Biol. 4:187–217.
-
- Caliskan, G., A. Kisliuk, and A. P. Sokolov. 2002. Dynamic transition in lysozyme: role of a solvent. Journal of Non-Crystalline Solids. 307–310:868–873.
MeSH terms
Substances
LinkOut - more resources
Full Text Sources

