. 2003 Aug 20;23(20):7577-85.
doi: 10.1523/JNEUROSCI.23-20-07577.2003.

Sodium channel beta4, a new disulfide-linked auxiliary subunit with similarity to beta2

Affiliations

Sodium channel beta4, a new disulfide-linked auxiliary subunit with similarity to beta2

Frank H Yu et al. J Neurosci. .

Abstract

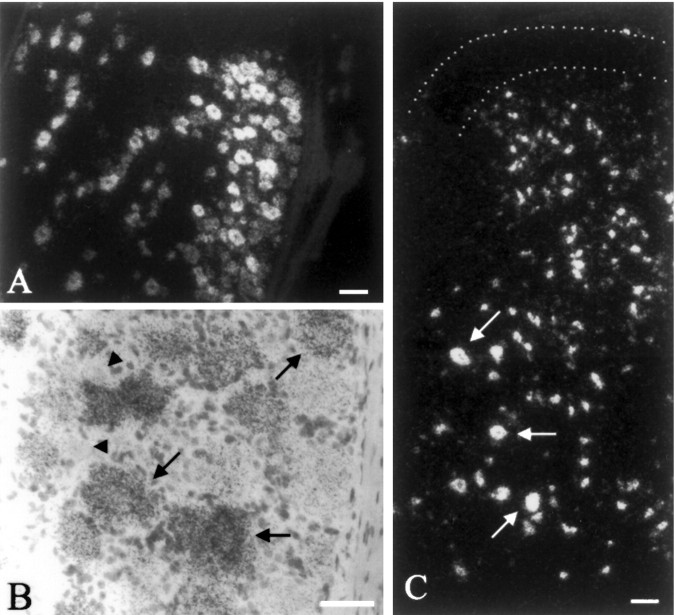
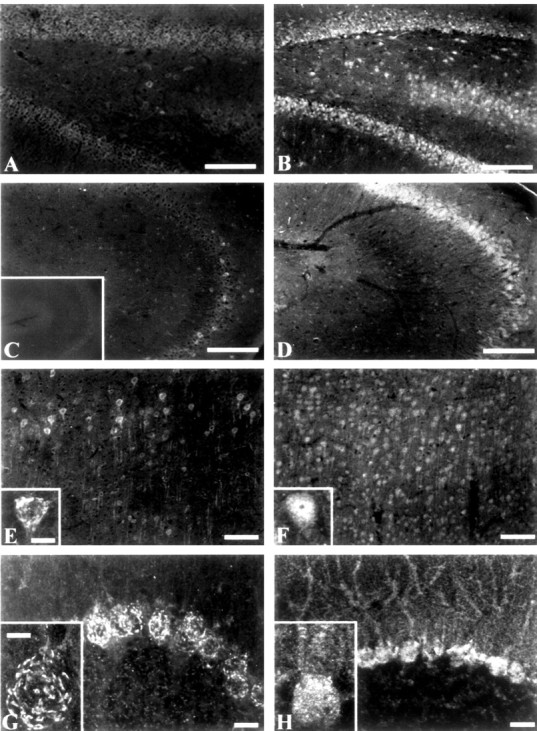
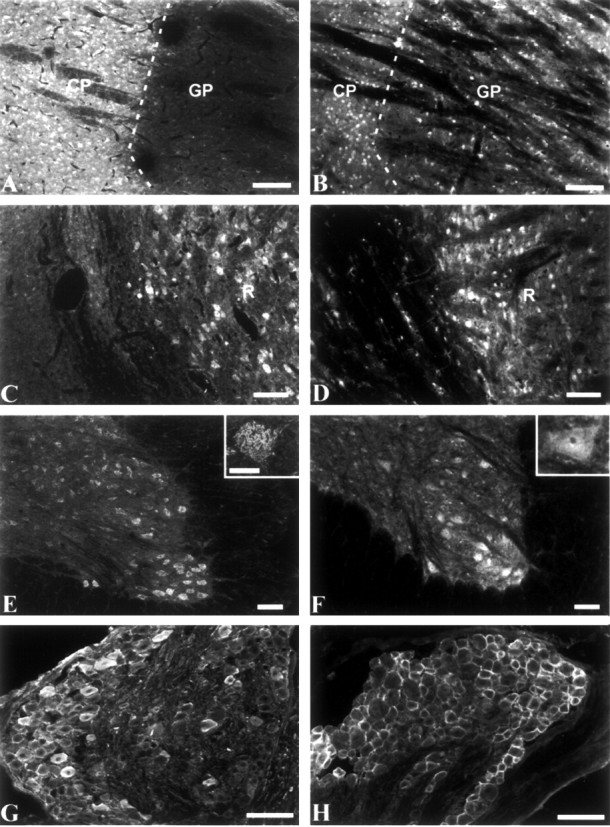
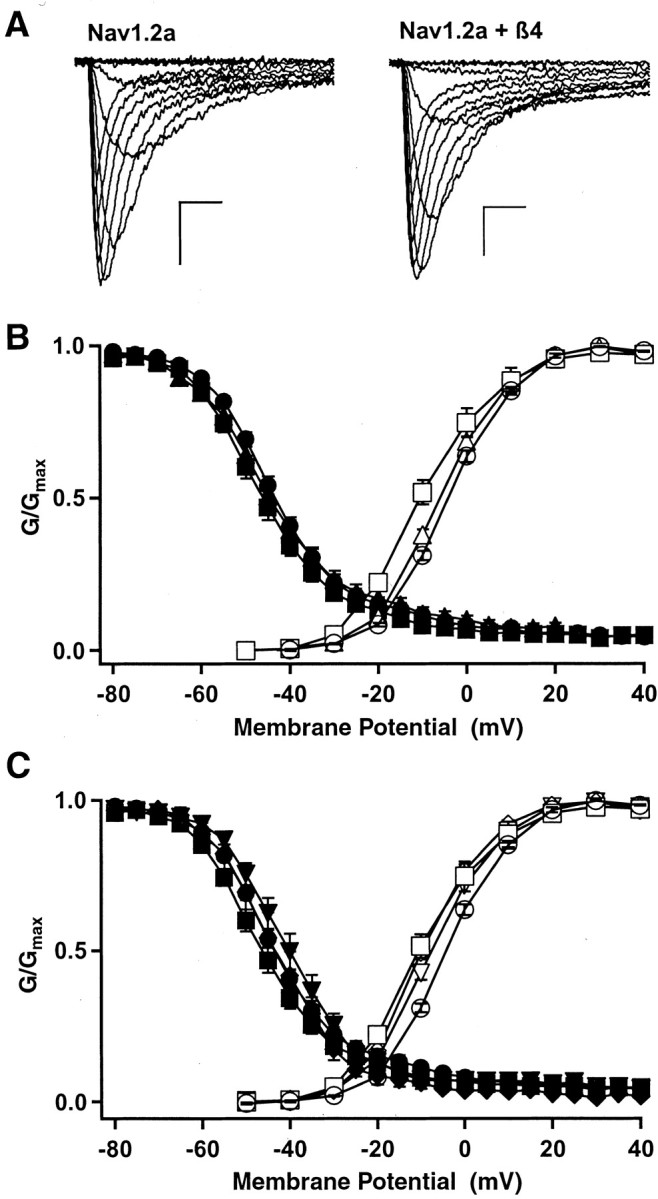
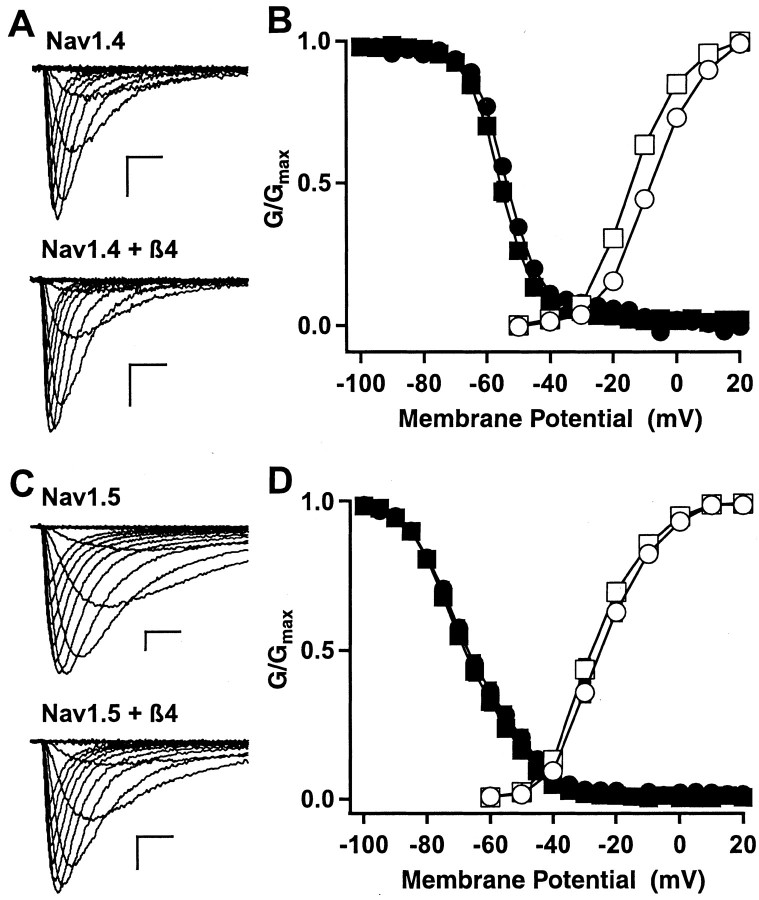
The principal alpha subunit of voltage-gated sodium channels is associated with auxiliary beta subunits that modify channel function and mediate protein-protein interactions. We have identified a new beta subunit termed beta4. Like the beta1-beta3 subunits, beta4 contains a cleaved signal sequence, an extracellular Ig-like fold, a transmembrane segment, and a short intracellular C-terminal tail. Using TaqMan reverse transcription-PCR analysis, in situ hybridization, and immunocytochemistry, we show that beta4 is widely distributed in neurons in the brain, spinal cord, and some sensory neurons.beta4 is most similar to the beta2 subunit (35% identity), and, like the beta2 subunit, the Ig-like fold of beta4 contains an unpaired cysteine that may interact with the alpha subunit. Under nonreducing conditions, beta4 has a molecular mass exceeding 250 kDa because of its covalent linkage to Nav1.2a, whereas on reduction, it migrates with a molecular mass of 38 kDa, similar to the mature glycosylated forms of the other beta subunits. Coexpression of beta4 with brain Nav1.2a and skeletal muscle Nav1.4 alpha subunits in tsA-201 cells resulted in a negative shift in the voltage dependence of channel activation, which overrode the opposite effects of beta1 and beta3 subunits when they were present. This novel, disulfide-linked beta subunit is likely to affect both protein-protein interactions and physiological function of multiple sodium channel alpha subunits.


Figures

Figure 1.
Figure 1.
Amino acid sequence and tissue distribution of the sodium channel β4 subunit. A, Alignment of human sodium channel β4 and β2 (hβ4 AY149967, hβ2 AAF21472) subunits using Clustal W. Identical residues are shown as white letters against black, and similar residues are black letters on gray. The solid box indicates the N-terminal signal sequence predicted for β4 and determined for β2 (Isom et al., 1995). Numbering of the amino acid sequence (above) is relative to the predicted first residue of the mature β4 protein after cleavage of the signal peptide. The asterisks show conserved cysteine residues that form a disulfide bond in the Ig-like domain. The solid triangle indicates the conserved cysteine in β2 and β4, which may be covalently linked to sodium channel α subunits. The dotted box indicates the predicted transmembrane domains. B, Expression of the sodium channelβ4 subunit in the CNS and peripheral tissues. TaqMan RT-PCR was used to quantify β4 subunit mRNA, expressed as arbitrary units relative to the 18 S RNA internal reference. Lane 1, Brain; lane 2, spinal cord; lane 3, dorsal root ganglion; lane 4, superior cervical ganglion; lane 5, hairy skin; lane 6, gastrocnemius muscle; lane 7, heart; lane 8, kidney; lane 9, liver; lane 10, lung; lane 11, spleen; lane 12, aorta; lane 13, adrenal gland; lane 14, salivary gland; lane 15, thyroid; lane 16, prostate; lane 17, thymus; lane 18, trachea; lane 19, testes; lane 20, colon.
Figure 2.
Figure 2.
Distribution of the sodium channel β4 subunit mRNA in the brain. Sodium channel mRNA distribution is shown in dark field autoradiograms of rat tissue sections. A, Cerebral cortex; B, Purkinje cell layer of the cerebellum; C, nucleus reticularis of the thalamus (indicated by the dotted line); D, hippocampus (arrows indicate the width of the pyramidal cell layer); E, caudate putamen (CP) and globus pallidus (GP). Scale bars, 100 μm.
Figure 3.
Figure 3.
Expression of the β4 subunit in the spinal cord and sensory neurons. A, Dark-field image of dorsal root ganglion neurons. B, Bright-field image of dorsal root ganglion neurons showing high expression in the majority of neurons (arrows) and absence of labeling in some small-diameter neurons (arrowheads). C, Dark-field micrograph showing labeling of neurons in most laminae of the spinal cord, including ventral horn motor neurons (arrows). Dotted line, Superficial laminae I and II of the dorsal horn. Scale bars, 100 μm.
Figure 4.
Figure 4.
Analysis of anti-β4 antibody specificity. TsA-201 cells were transfected individually with β1-β4 expression plasmids. Purified membrane proteins (10 μg) were fractionated by SDS-PAGE, immunoblotted, and probed using anti-β4 antibody.
Figure 5.
Figure 5.
Localization of β2 and β4 subunits in the hippocampus, cerebral cortex, and cerebellum. Tissue sections were stained with either anti-β4 (A, C, E, G) or anti-β2(B, D, F, H). A, B, Dentate gyrus of the hippocampus. Scale bar, 250 μm. C, D, CA3 region of the hippocampus. Scale bar, 250 μm. C, inset, Typical control of an adjacent slice without primary antibody. E, F, Low-magnification views of dorsal cerebral cortex. Scale bar, 100 μm. Insets, High-magnification views of layer V neurons. Scale bar, 25 μm. G, H, Purkinje cell layer of the cerebellum. Scale bars, 50 μm. Insets, High-magnification views of cerebellar Purkinje cells. Scale bar, 25 μm.
Figure 6.
Figure 6.
Immunocytochemical localization of β2 and β4 in the basal ganglia and thalamus. Tissue sections were stained with either anti-β4 (A, C, E, G) or antiβ2 (B, D, F, H). A, B, Caudate-putamen (CP) and globus pallidus (GP). C, D, Reticular nucleus of the thalamus. Scale bars, 100 μm. E, F, Spinal cord, low magnification. Scale bars, 250 μm. Insets, Spinal motor neurons, high magnification. Scale bar, 50 μm. G, H, Low-magnification views of dorsal root ganglion. Scale bars, 100 μm.
Figure 7.
Figure 7.
Association of Nav1.2a with β4 when coexpressed in tsA-201 cells. A, Coexpression of N-terminal HA-tagged Nav1.2a α subunits and C-terminal HA-tagged β4 subunits in tsA-201 cells. Solubilized proteins were immunoprecipitated with anti-SP20 recognizing the Nav1.2a α subunit, resolved by SDS-PAGE, and immunoblotted using an anti-HA11 monoclonal antibody. Immunoreactive products of ∼250 and 38 kDa were observed, corresponding to Nav1.2a α and β4 subunits, respectively. B, Coexpression of untagged Nav1.2a α subunit with HA-tagged β4. Sodium channel complexes were immunoprecipitated from solubilized proteins using anti-SP20, denatured, and separated by SDS-PAGE under nonreducing (left) or reducing (right) conditions in the presence of 5% β-mercaptoethanol and immunoblotted with anti-HA11.
Figure 8.
Figure 8.
Effects of coexpression of β subunits on the functional properties of the Nav1.2a subunit. A, Families of sodium current traces recorded from a tsA-201 cell transfected with the Nav1.2a α subunit alone (left) or coexpressed with β4 (right). Calibration: 1 nA, 1 msec. B, Conductance-voltage (open symbols) and steady-state (filled symbols) inactivation curves for cells transfected with Nav1.2a α alone (circles), Nav1.2a α with β2 (triangles), and Nav1.2a α with β4 (squares). C, Conductance-voltage (open symbols) and steady-state inactivation (filled symbols) relationships for Nav1.2a α alone (circles), Nav1.2a α with β4 (squares), Nav1.2a α with β1 and β4 (inverted triangles), and Nav1.2a α with β3 and β4 (diamonds).
Figure 9.
Figure 9.
Effects of β4 coexpression on the functional properties of Nav1.4 and Nav1.5 α subunits. A, Families of sodium current traces recorded from cells expressing the Nav1.4 α subunit alone (top) or coexpressed with β4 (bottom). Calibration: 1 nA, 1 msec. B, Conductance-voltage (open symbols) and inactivation (filled symbols) relationships for Nav1.4 α alone (circles) and Nav1.4 α with β4 (squares). The midpoints of activation curves were -8.0 ± 0.5 mV (n = 10) for Nav1.4 and -14.1 ± 0.6 mV (n = 12) for Nav1.4 with β4. The midpoints of inactivation curves were -52.8 ± 0.5 mV (n = 7) for Nav1.4 and -55.4 ± 0.7 mV (n = 8) for Nav1.4 with β4. C, Families of sodium current traces recorded from cells expressing the Nav1.5 α subunit alone (top) or coexpressed with β4 (bottom). Calibration: 1 nA, 1 msec. D, Conductance-voltage (open symbols) and inactivation (filled symbols) relationships for Nav1.5 α alone (circles) and Nav1.5 α with β4 (squares). The midpoints of activation curves were -24.9 ± 0.9 mV (n = 13) for Nav1.5 and -27.5 ± 1.2 mV (n = 12) for Nav1.5 with β4. The midpoints of inactivation curves were -66.4 ± 1.1 mV (n = 14) for Nav1.5 and -67.8 ± 1.2 mV (n = 12) for Nav1.5 with β4.

Similar articles

Cited by

References

    1. Altschul SF, Madden TL, Schäffer AA, Zhang J, Zhang Z, Miller W, Lipman DJ ( 1997) Gapped BLAST and PSI-BLAST: a new generation of protein database search programs. Nucleic Acids Res 25: 3389-3402. - PMC - PubMed
    1. Catterall WA ( 2000) From ionic currents to molecular mechanisms: the structure and function of voltage-gated sodium channels. Neuron 26: 13-25. - PubMed
    1. Claes L, Del-Favero J, Ceulemans B, Lagae L, Van Broeckhoven C, De Jonghe P ( 2001) De novo mutations in the sodium-channel gene SCN1A cause severe myoclonic epilepsy of infancy. Am J Hum Genet 68: 1327-1332. - PMC - PubMed
    1. Escayg A, MacDonald BT, Meisler MH, Baulac S, Huberfeld G, An-Gourfinkel I, Brice A, LeGuern E, Moulard B, Chaigne D, Buresi C, Malafosse A ( 2000) Mutations of SCN1A, encoding a neuronal sodium channel, in two families with GEFS+2. Nat Genet 24: 343-345. - PubMed
    1. Eubanks J, Srinivasan J, Dinulos MB, Disteche CM, Catterall WA ( 1997) Structure and chromosomal localization of the β2 subunit of the human brain sodium channel. NeuroReport 8: 2775-2779. - PubMed

Publication types

MeSH terms