. 2003 Aug;14(8):3254-65.
doi: 10.1091/mbc.e02-12-0809. Epub 2003 May 18.

Selective caveolin-1-dependent endocytosis of glycosphingolipids

Affiliations

Selective caveolin-1-dependent endocytosis of glycosphingolipids

Raman Deep Singh et al. Mol Biol Cell. 2003 Aug.

Abstract

We studied the endocytosis of fluorescent glycosphingolipid (GSL) analogs in various cell types using pathway-specific inhibitors and colocalization studies with endocytic markers and DsRed caveolin-1 (cav-1). Based on inhibitor studies, all GSLs tested were internalized predominantly (>80%) by a clathrin-independent, caveolar-related mechanism, regardless of cell type. In addition, fluorescent lactosylceramide (LacCer) colocalized with DsRed-cav-1 in vesicular structures upon endocytosis in rat fibroblasts. The internalization mechanism for GSLs was unaffected by varying the carbohydrate headgroup or sphingosine backbone chain length; however, a fluorescent phosphatidylcholine analog was not internalized via caveolae, suggesting that the GSL ceramide core may be important for caveolar uptake. Internalization of fluorescent LacCer was reduced 80-90% in cell types with low cav-1, but was dramatically stimulated by cav-1 overexpression. However, even in cells with low levels of cav-1, residual LacCer internalization was clathrin independent. In contrast, cholera toxin B subunit (CtxB), which binds endogenous GM1, was internalized via clathrin-independent endocytosis in cells with high cav-1 expression, whereas significant clathrin-dependent uptake occurred in cells with low cav-1. Fluorescent GM1, normally internalized by clathrin-independent endocytosis in HeLa cells with low cav-1, was induced to partially internalize via the clathrin pathway in the presence of CtxB. These results suggest that GSL analogs are selectively internalized via a caveolar-related mechanism in most cell types, whereas CtxB may undergo "pathway switching" when cav-1 levels are low.


Figures
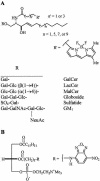
Figure 1.
Figure 1.
Structures of fluorescent lipid analogs used in the present study. (A) Various headgroups (R) were attached to BODIPY-ceramide, resulting in BODIPY-GalCer, -LacCer, -MalCer, -globoside, -sulfatide, or -GM1. BODIPY-LacCer analogs were also synthesized using various chain length (C12, C16, C18, or C20) sphingosines or BODIPY-fatty acids (C3 vs. C5 spacer). Fluorescent LacCer bearing an NBD-fatty acid (see B) in place of the BODIPY-fatty acid was also synthesized. (B) Structure of the d-isomer of NBD-labeled PC, a glycerolipid.
Figure 2.
Figure 2.
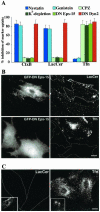
Differential internalization of endocytic markers and fluorescent lipid analogs in rat fibroblasts. (A) RFs were pretreated with the indicated pharmacological inhibitor or transfected with DN Eps15 or Dyn2 constructs and the internalization (5 min at 37°C) of fluorescent CtxB, Tfn, or BODIPY-LacCer, relative to untreated control samples was quantified by image analysis. Note the similarity of LacCer to CtxB internalization in response to the various treatments. Representative fluorescence micrographs showing the differential internalization (5 min at 37°C) of LacCer vs. Tfn are given in B for RFs transfected with DN Eps15 (white outlines indicate transfected cells) or in C for RFs pretreated with nystatin (white outlines indicate position of cells observed by phase microscopy). Insets show LacCer or Tfn internalization in untreated control cells. Bars, 10 μm.
Figure 3.
Figure 3.
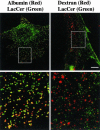
Colocalization of BODIPY-LacCer with fluorescent albumin vs. dextran in rat fibroblasts. RFs were incubated with BODIPYLacCer for 30 min at 4°C, washed, and further incubated for 3 min at 37°C with 30 μg/ml AF594-conjugated albumin or 5 min at 37°C with 1 mg/ml Cascade blue dextran. After back-exchange at 10°C to remove any LacCer remaining at the PM (see MATERIALS AND METHODS), the samples were observed under the fluorescence microscope, and separate images were acquired for each fluorophore. Images were rendered in pseudocolor and are presented as overlays: LacCer, green; albumin, red; dextran, red. Note the extensive colocalization of LacCer with albumin but not with dextran. Boxed areas are shown at higher magnification in the corresponding bottom panels. Bar, 10 μm.
Figure 4.
Figure 4.
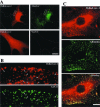
DsRed-cav-1 colocalization with BODIPY-LacCer and fluorescent albumin. RFs were transfected with DsRed-cav-1 and 48 h later the distribution of (A and B) BODIPY-LacCer or (C) AF488 albumin after 2 min of internalization at 37°C was examined. Top panels in A show the same field for cav-1 (red) or LacCer (green). Note that in an adjacent nontransfected cell outlined in white, there was no spillover of LacCer fluorescence into the DsRed channel. Bottom panels in (A) show a control experiment using transfected cells without LacCer labeling. Note that no DsRed fluorescence appeared in the green channel at the exposure setting used for LacCer in the doubly labeled specimen. The boxed regions in A are shown at higher magnification in B. Note the similar patterns of punctate fluorescence (e.g., at arrows) for LacCer and cav-1. Quantitative analysis indicated that at least ∼90% of the green puncta colocalized with DsRed-cav-1. However, not all DsRed-cav-1 puncta were positive for LacCer (e.g., see +s). (C) Fluorescence micrographs of a cell expressing DsRed-cav-1 and labeled with AF488 albumin. More than 95% of the AF488 puncta colocalized with DsRed-cav-1. Bars, 10 μm.
Figure 5.
Figure 5.
BODIPY-LacCer internalization in RFs vs. HeLa cells. Cells were incubated with 2 μM BODIPY-LacCer for 30 min at 10°C, washed and observed immediately (top panels) or warmed for 5 min at 37°C before back-exchange and microscopy (bottom panels). All images were exposed and printed identically. Note that although the PM labeling (0 min) was similar for both cell types, the amount of internalization was greatly reduced in HeLa cells. Bar, 10 μm.
Figure 6.
Figure 6.
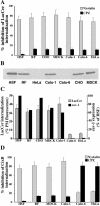
LacCer and CtxB internalization compared with cav-1 expression in multiple cell types. (A) Cells were pretreated with nystatin or CPZ and the internalization of BODIPY-LacCer was quantified after 5 min at 37°C (see MATERIALS AND METHODS). Values are expressed as percent inhibition relative to untreated control samples. In control experiments (unpublished data), the initial labeling of the PM before internalization was shown to be approximately the same for each cell type. (B) Western blot for Cav-1 in cell lysates prepared from various cell types. The amount of total cell protein was the same (10 μg) for each lane. Low but detectable levels of cav-1 were seen in Calu-6 and HeLa cell extracts using longer exposures. (C) Extent of LacCer internalization (5 min at 37°C) expressed as a percentage of initial PM labeling compared with cav-1 expression levels (relative to HSFs) determined by quantitation of Western blots as in B. (D) Cells were pretreated as in A and then incubated with 7.5 μg/ml AF594-CtxB for 45 min at 10°C, washed, and warmed to 37°C for 5 min. Samples were then washed and acid-stripped, and internalization was quantified as in A. Values in A and D are expressed as percentage of untreated control samples and are mean ± SD of at least 10 cells in each of three independent experiments.
Figure 7.
Figure 7.
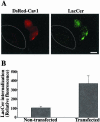
Caveolin-1 overexpression stimulates LacCer internalization. HeLa cells were transfected with DsRed-cav-1 for 48 h. Cells were then pulse-labeled with BODIPY-LacCer as in Figure 4. (A) Fluorescence micrograph showing two transfected cells (identified by DsRed fluorescence) and a nontransfected cell in the same field. LacCer was observed at green wavelengths (see MATERIALS AND METHODS). Note the stimulation of LacCer internalization in the transfected cell, relative to the neighboring nontransfected cell outlined in white. Bar, 10 μm. (B) Quantitation of LacCer internalization in transfected vs. nontransfected cells by image analysis. Values are the mean ± SD of at least 10 cells in each of three independent experiments.
Figure 8.
Figure 8.
Effect of CtxB on the internalization of fluorescent GM1 in HeLa cells. (A) Cells were untreated or pretreated with nystatin or CPZ, washed, and incubated with 1 μM BODIPY-GM1 at 10°C to label the PM. Samples were washed and further incubated in HMEM without (–CtxB) or with AF594-CtxB (+CtxB) for 1 h at 10°C. The intensity of BODIPY-fluorescence at the PM was the same (±10%) with or without bound CtxB (unpublished data). The samples were then washed, warmed to 37°C for 5 min, washed, acid-stripped, and back-exchanged to remove CtxB and fluorescent lipid from the PM, and observed under the fluorescence microscope (see MATERIALS AND METHODS). Note that the presence of bound toxin (+CtxB panels) dramatically altered the relative inhibition by nystatin vs. CPZ of BODIPY-GM1 internalization which was viewed at green wavelengths. (B) Colocalization of BODIPY-GM1 with AF594-CtxB after coincubation in the absence of inhibitors as in A. (C) Quantitation of experiment shown in A. Values are mean ± SD of at least 10 cells in each of the three independent experiments. Bars, 10 μm.

Similar articles

Cited by

References

    1. Aktories, K., Schmidt, G., and Just, I. (2000). Rho GTPases as targets of bacterial protein toxins. Biol. Chem. 381, 421–426. - PubMed
    1. Anderson, R.G. (1998). The caveolae membrane system. Annu. Rev. Biochem. 67, 199–225. - PubMed
    1. Anderson, R.G., and Jacobson, K. (2002). A role for lipid shells in targeting proteins to caveolae, rafts, and other lipid domains. Science 296, 1821–1825. - PubMed
    1. Aoki, T., Nomura, R., and Fujimoto, T. (1999). Tyrosine phosphorylation of Caveolin-1 in the endothelium. Exp. Cell Res. 253, 629–636. - PubMed
    1. Brown, D.A., and London, E. (2000). Structure and function of sphingolipid- and cholesterol-rich membrane rafts. J. Biol. Chem. 275, 17221–17224. - PubMed

Publication types

LinkOut - more resources