Visualizing infection of individual influenza viruses
- PMID: 12883000
- PMCID: PMC170909
- DOI: 10.1073/pnas.0832269100
Visualizing infection of individual influenza viruses
Abstract
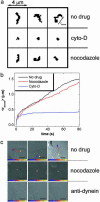
Influenza is a paradigm for understanding viral infections. As an opportunistic pathogen exploiting the cellular endocytic machinery for infection, influenza is also a valuable model system for exploring the cell's constitutive endocytic pathway. We have studied the transport, acidification, and fusion of single influenza viruses in living cells by using real-time fluorescence microscopy and have dissected individual stages of the viral entry pathway. The movement of individual viruses revealed a striking three-stage active transport process that preceded viral fusion with endosomes starting with an actin-dependent movement in the cell periphery, followed by a rapid, dynein-directed translocation to the perinuclear region, and finally an intermittent movement involving both plus- and minus-end-directed microtubule-based motilities in the perinuclear region. Surprisingly, the majority of viruses experience their initial acidification in the perinuclear region immediately following the dynein-directed rapid translocation step. This finding suggests a previously undescribed scenario of the endocytic pathway toward late endosomes: endosome maturation, including initial acidification, largely occurs in the perinuclear region.
Figures


Similar articles
-
Assembly of endocytic machinery around individual influenza viruses during viral entry.Nat Struct Mol Biol. 2004 Jun;11(6):567-73. doi: 10.1038/nsmb769. Epub 2004 May 2. Nat Struct Mol Biol. 2004. PMID: 15122347 Free PMC article.
-
A "Driver Switchover" Mechanism of Influenza Virus Transport from Microfilaments to Microtubules.ACS Nano. 2018 Jan 23;12(1):474-484. doi: 10.1021/acsnano.7b06926. Epub 2017 Dec 15. ACS Nano. 2018. PMID: 29232101
-
Transport of the influenza virus genome from nucleus to nucleus.Viruses. 2013 Oct 2;5(10):2424-46. doi: 10.3390/v5102424. Viruses. 2013. PMID: 24104053 Free PMC article. Review.
-
Quantitative RT-PCR Analysis of Influenza Virus Endocytic Escape.Methods Mol Biol. 2018;1836:185-194. doi: 10.1007/978-1-4939-8678-1_9. Methods Mol Biol. 2018. PMID: 30151574
-
Entry of influenza virus.Adv Exp Med Biol. 2013;790:72-82. doi: 10.1007/978-1-4614-7651-1_4. Adv Exp Med Biol. 2013. PMID: 23884586 Review.
Cited by
-
Imaging of Viral Genomic RNA Replication with Nanoprobes.Methods Mol Biol. 2025;2875:145-153. doi: 10.1007/978-1-0716-4248-1_12. Methods Mol Biol. 2025. PMID: 39535646
-
Revealing mitochondrial microenvironmental changes triggered by ferroptosis regulation.Anal Bioanal Chem. 2024 Nov 13. doi: 10.1007/s00216-024-05638-6. Online ahead of print. Anal Bioanal Chem. 2024. PMID: 39535559
-
Early Steps of Individual Multireceptor Viral Interactions Dissected by High-Density, Multicolor Quantum Dot Mapping in Living Cells.ACS Nano. 2024 Oct 22;18(42):28881-28893. doi: 10.1021/acsnano.4c09085. Epub 2024 Oct 10. ACS Nano. 2024. PMID: 39387532 Free PMC article.
-
Trajectory Analysis in Single-Particle Tracking: From Mean Squared Displacement to Machine Learning Approaches.Int J Mol Sci. 2024 Aug 8;25(16):8660. doi: 10.3390/ijms25168660. Int J Mol Sci. 2024. PMID: 39201346 Free PMC article. Review.
-
The Roles of Endocytosis and Autophagy at the Cellular Level During Influenza Virus Infection: A Mini-Review.Infect Drug Resist. 2024 Jul 24;17:3199-3208. doi: 10.2147/IDR.S471204. eCollection 2024. Infect Drug Resist. 2024. PMID: 39070720 Free PMC article. Review.
References
-
- Goldstein, J. L., Brown, M. S., Anderson, R. G. W., Russell, D. W. & Schneider, W. J. (1985) Annu. Rev. Cell Biol. 1, 1–39. - PubMed
Publication types
MeSH terms
Substances
LinkOut - more resources
Full Text Sources
Other Literature Sources
Research Materials

