Development of rat CA1 neurones in acute versus organotypic slices: role of experience in synaptic morphology and activity
- PMID: 12879864
- PMCID: PMC2343027
- DOI: 10.1113/jphysiol.2003.039099
Development of rat CA1 neurones in acute versus organotypic slices: role of experience in synaptic morphology and activity
Abstract
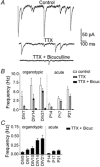
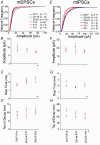
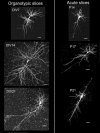
Despite their wide use, the physiological relevance of organotypic slices remains controversial. Such cultures are prepared at 5 days postnatal. Although some local circuitry remains intact, they develop subsequently in isolation from the animal and hence without plasticity due to experience. Development of synaptic connectivity and morphology might be expected to proceed differently under these conditions than in a behaving animal. To address these questions, patch-clamp techniques and confocal microscopy were used in the CA1 region of the rat hippocampus to compare acute slices from the third postnatal week with various stages of organotypic slices. Acute slices prepared at postnatal days (P) 14, 17 and 21 were found to be developmentally equivalent to organotypic slices cultured for 1, 2 and 3 weeks, respectively, in terms of development of synaptic transmission and dendritic morphology. The frequency of inhibitory and excitatory miniature synaptic currents increased in parallel. Development of dendritic length and primary branching as well as spine density and proportions of different spine types were also similar in both preparations,at these corresponding stages. The most notable difference between organotypic and acute slices was a four- to five-fold increase in the absolute frequency of glutamatergic (but not GABAergic)miniature postsynaptic currents in organotypic slices. This was probably related to an increase in complexity of higher order dendritic branching in organotypic slices, as measured by fractal analysis, resulting in an increased total synapse number. Both increased excitatory miniature synaptic current frequency and dendritic complexity were already established during the first week in culture. The level of complexity then stayed constant in both preparations over subsequent stages, with synaptic frequency increasing in parallel. Thus, although connectivity was greater in organotypic slices, once this was established, development continued in both preparations at are markably similar rate. We conclude that, for the parameters studied, changes seem to be preprogrammed by 5 days and their subsequent development is largely independent of environment.
Figures


Similar articles
-
Protracted postnatal development of inhibitory synaptic transmission in rat hippocampal area CA1 neurons.J Neurophysiol. 2000 Nov;84(5):2465-76. doi: 10.1152/jn.2000.84.5.2465. J Neurophysiol. 2000. PMID: 11067989
-
Pathway specificity of dendritic spine morphology in identified synapses onto rat hippocampal CA1 neurons in organotypic slices.Hippocampus. 2006;16(12):1111-24. doi: 10.1002/hipo.20236. Hippocampus. 2006. PMID: 17068782
-
The hyperexcitability of dentate granule neurons in organotypic hippocampal slice cultures is due to reorganization of synaptic inputs in vitro.Physiol Rep. 2016 Oct;4(19):e12889. doi: 10.14814/phy2.12889. Physiol Rep. 2016. PMID: 27707779 Free PMC article.
-
Miniature synaptic transmission and BDNF modulate dendritic spine growth and form in rat CA1 neurones.J Physiol. 2003 Dec 1;553(Pt 2):497-509. doi: 10.1113/jphysiol.2003.052639. Epub 2003 Sep 18. J Physiol. 2003. PMID: 14500767 Free PMC article.
-
Spontaneous recurrent network activity in organotypic rat hippocampal slices.Eur J Neurosci. 2005 Jul;22(1):107-18. doi: 10.1111/j.1460-9568.2005.04198.x. Eur J Neurosci. 2005. PMID: 16029200
Cited by
-
Spine calcium transients induced by synaptically-evoked action potentials can predict synapse location and establish synaptic democracy.PLoS Comput Biol. 2012;8(6):e1002545. doi: 10.1371/journal.pcbi.1002545. Epub 2012 Jun 14. PLoS Comput Biol. 2012. PMID: 22719238 Free PMC article.
-
Perisynaptic chondroitin sulfate proteoglycans restrict structural plasticity in an integrin-dependent manner.J Neurosci. 2012 Dec 12;32(50):18009-17, 18017a. doi: 10.1523/JNEUROSCI.2406-12.2012. J Neurosci. 2012. PMID: 23238717 Free PMC article.
-
Perfused drop microfluidic device for brain slice culture-based drug discovery.Biomed Microdevices. 2016 Jun;18(3):46. doi: 10.1007/s10544-016-0073-z. Biomed Microdevices. 2016. PMID: 27194028 Free PMC article.
-
Fluorescence microscopy shadow imaging for neuroscience.Front Cell Neurosci. 2024 Feb 15;18:1330100. doi: 10.3389/fncel.2024.1330100. eCollection 2024. Front Cell Neurosci. 2024. PMID: 38425431 Free PMC article. Review.
-
Astrocytes control glutamate receptor levels at developing synapses through SPARC-beta-integrin interactions.J Neurosci. 2011 Mar 16;31(11):4154-65. doi: 10.1523/JNEUROSCI.4757-10.2011. J Neurosci. 2011. PMID: 21411656 Free PMC article.
References
-
- Cannon RC, Wheal HV, Turner DA. Dendrites of classes of hippocampal neurons differ in structural complexity and branching patterns. J Comp Neurol. 1999;413:619–633. - PubMed
-
- Caserta F, Stanley HE, Eldred WD, Daccord G, Hausman RE, Nittmann J. Physical mechanisms underlying neurite outgrowth: a quantitative analysis of neuronal shape. Phys Rev Lett. 1990;64:95–98. - PubMed
-
- Collin C, Miyaguchi K, Segal M. Dendritic spine density and LTP induction in cultured hippocampal slices. J Neurophysiol. 1997;77:1614–1623. - PubMed
-
- Coltman BW, Earley EM, Shahar A, Dudek FE, Ide CF. Factors influencing mossy fiber collateral sprouting in organotypic slice cultures of neonatal mouse hippocampus. J Comp Neurol. 1995;362:209–222. - PubMed
Publication types
MeSH terms
Substances
LinkOut - more resources
Full Text Sources
Miscellaneous

