

Review
doi: 10.1038/sj.bjc.6601118.
Survival analysis part I: basic concepts and first analyses
Affiliations
- PMID: 12865907
- PMCID: PMC2394262
- DOI: 10.1038/sj.bjc.6601118
Item in Clipboard
Review
Survival analysis part I: basic concepts and first analyses
Br J Cancer.
.
No abstract available
Figures
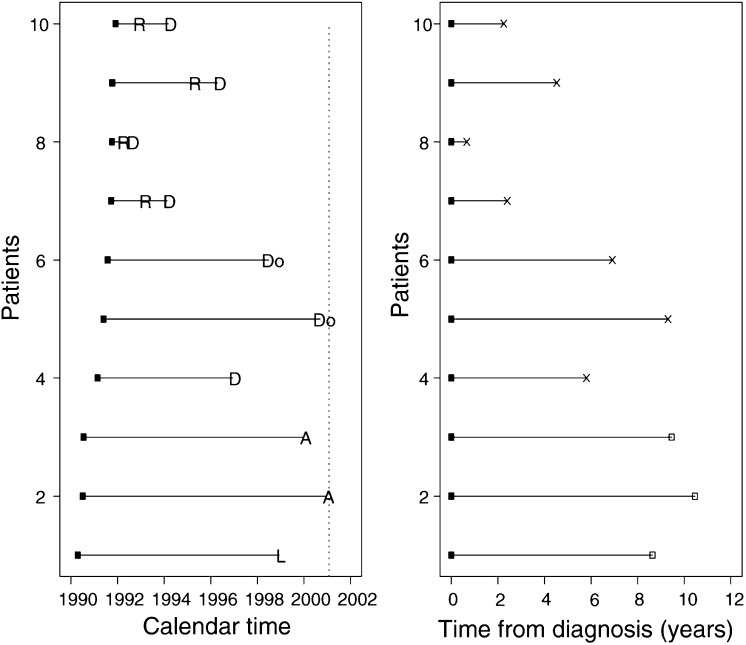
Converting calendar time in the ovarian cancer study to a survival analysis format. Dashed vertical line is the date of the last follow-up, R=relapse, D=death from ovarian cancer, Do=death from other cause, A=attended last clinic visit (alive), L=loss to follow-up, X=death, □=censored.
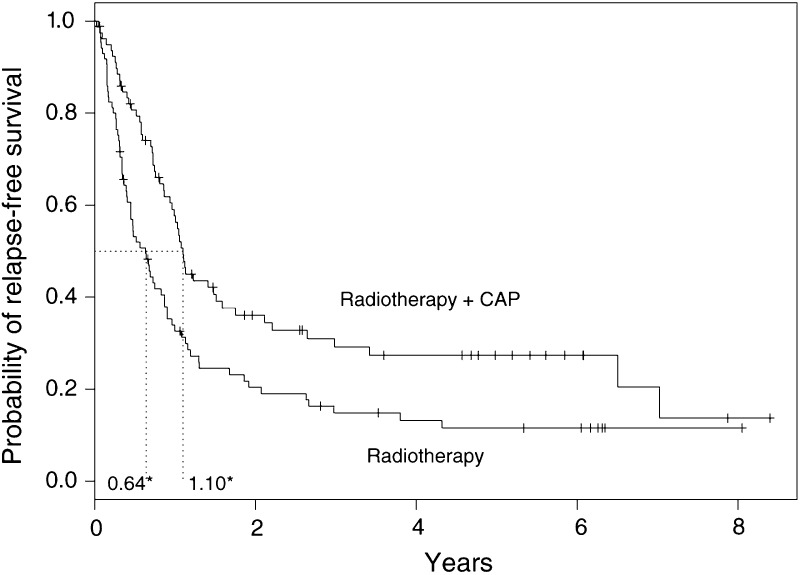
Relapse-free survival curves for the lung cancer trial. * Median relapse-free survival time for each arm, + censoring times, CAP=cytoxan, doxorubicin and platinum-based chemotherapy.
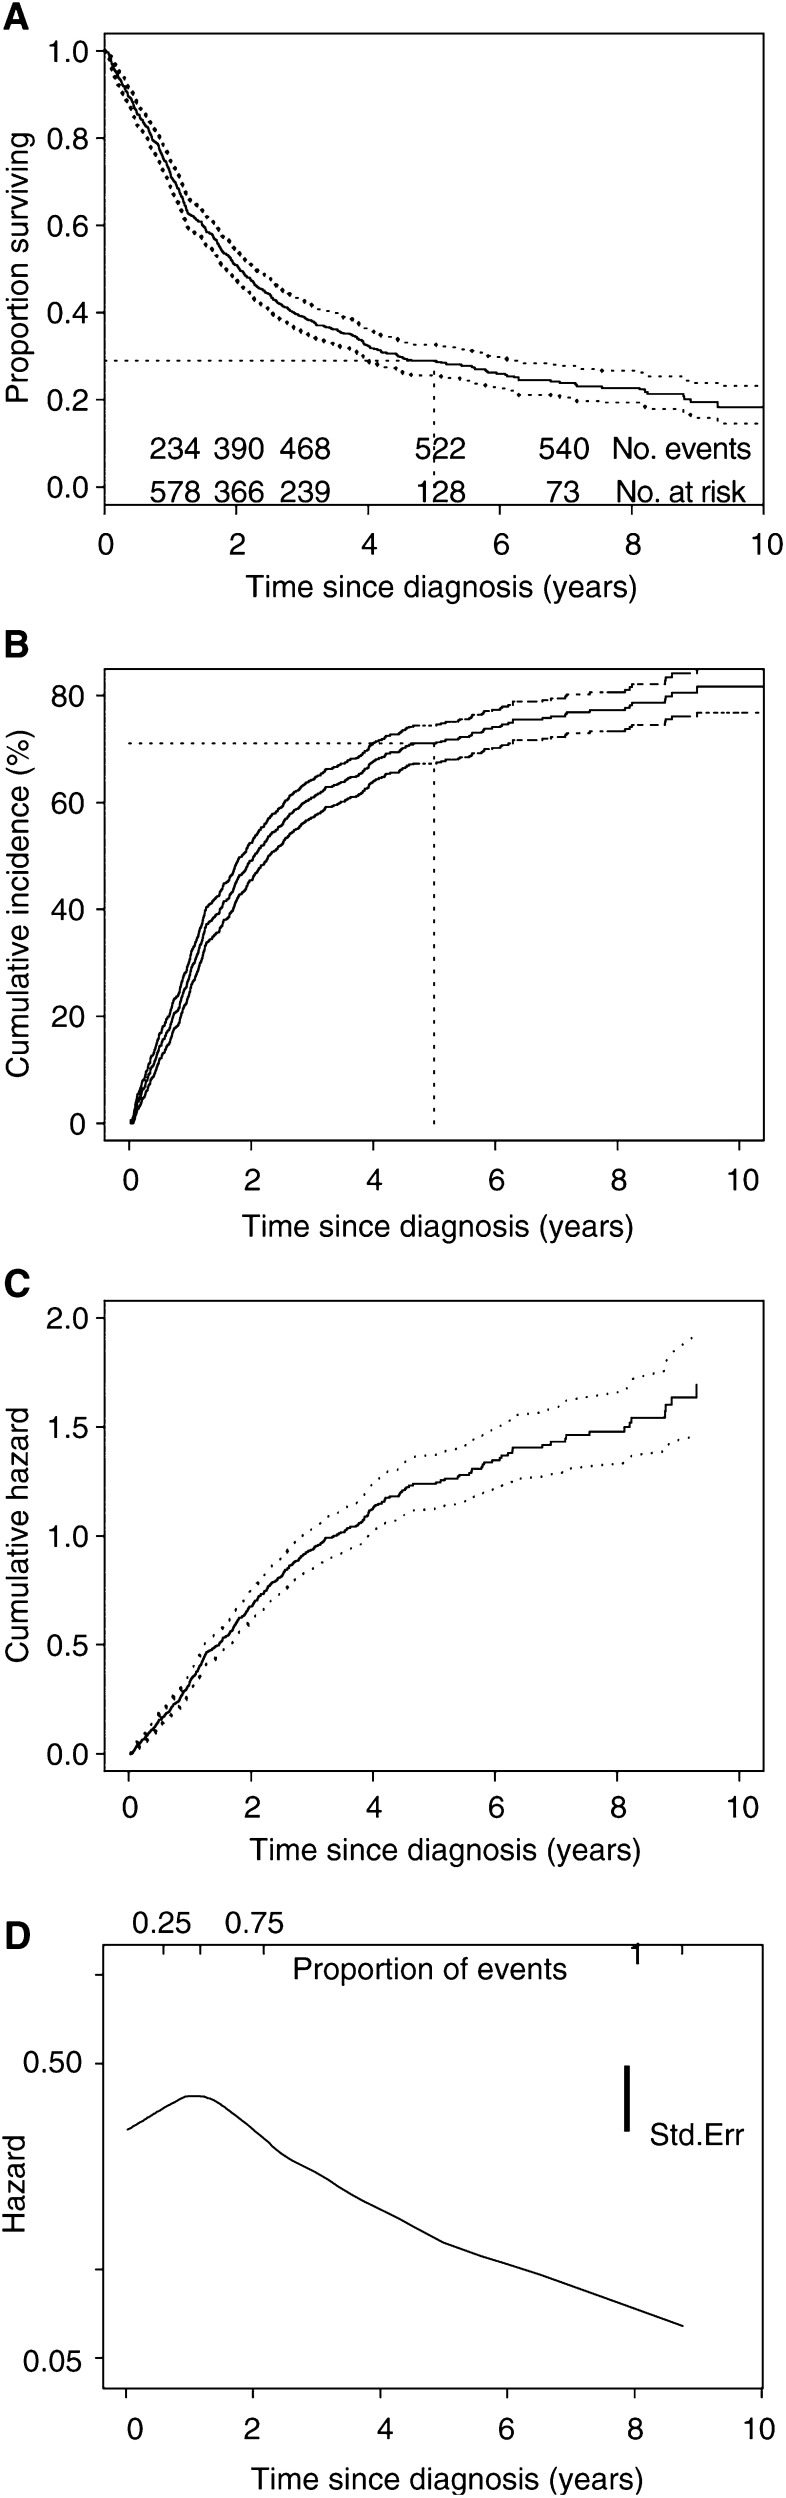
Survival and cumulative hazard curves with 95% CIs for the ovarian cancer study. Std.Err=standard error. (A) Kaplan–Meier survivor function, (B) cumulative incidence curve, (C) cumulative hazard function, (D) hazard function (smoothed).
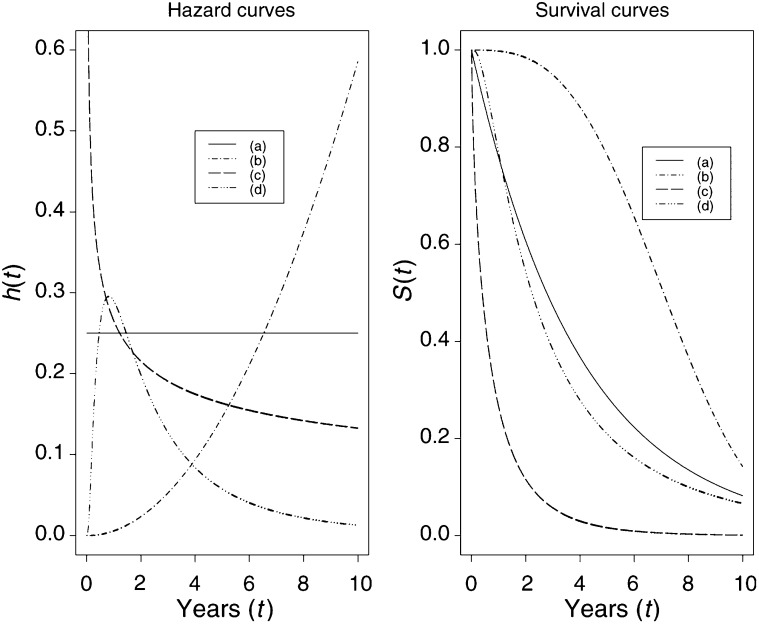
Relationships between (parametric) hazard and survival curves: (a) constant hazard (e.g. healthy persons), (b) increasing Weibull (e.g. leukaemia patients), (c) decreasing Weibull (e.g. patients recovering from surgery), (d) increasing and then decreasing log-normal (e.g. tuberculosis patients).
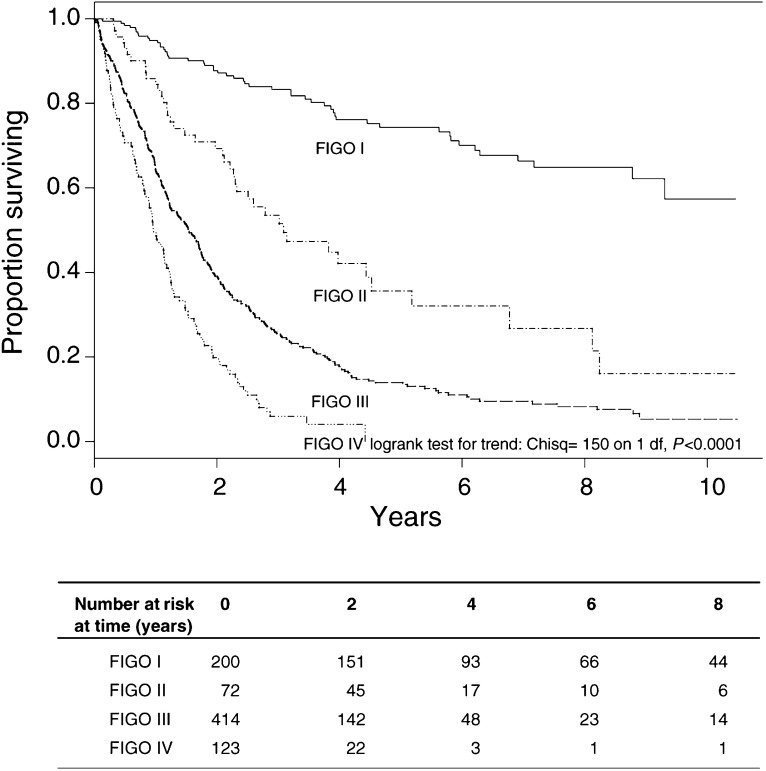
FIGO stage and prognosis in the ovarian study. Chisq=χ2.
Similar articles
-
Combined treatment modality in small cell lung cancer : the impact of radiotherapy on survival.Strahlenther Onkol. 2008 Feb;184(2):61-6. doi: 10.1007/s00066-008-1839-x. Strahlenther Onkol. 2008. PMID: 18259696 Review. No abstract available.
-
Clinical trials available using radiolabeled MoAbs against colon cancer, lung cancer, ovarian cancer, and hepatic metastases.Oncology (Williston Park). 1990 Aug;4(8):100-1. Oncology (Williston Park). 1990. PMID: 2145005 No abstract available.
-
The clinician as investigator: participating in clinical trials in the practice setting: Appendix 2: statistical concepts in study design and analysis.Circulation. 2004 Jun 1;109(21):e305-7. doi: 10.1161/01.CIR.0000129020.43304.A7. Circulation. 2004. PMID: 15173053 Review. No abstract available.
-
Concept of optimal surgical cytoreduction in advanced ovarian cancer: a brief critique and a call for action.J Clin Oncol. 2007 Sep 20;25(27):4168-70. doi: 10.1200/JCO.2007.11.8992. Epub 2007 Aug 27. J Clin Oncol. 2007. PMID: 17724348 No abstract available.
-
Optimizing management of recurrent epithelial ovarian cancer: a critical need for evidence-based data.Oncology. 2006;71(5-6):309-11. doi: 10.1159/000108591. Epub 2007 Sep 17. Oncology. 2006. PMID: 17873498 No abstract available.
Cited by
-
Advanced statistical methods for hazard modeling in cardiothoracic surgery: a comprehensive review of techniques and approaches.Indian J Thorac Cardiovasc Surg. 2024 Sep;40(5):633-644. doi: 10.1007/s12055-024-01799-2. Epub 2024 Jul 31. Indian J Thorac Cardiovasc Surg. 2024. PMID: 39156066
-
The prognostic role of PD-L1 expression and the presence of polyomavirus in Merkel cell carcinoma cases.Infect Agent Cancer. 2024 Jan 4;19(1):1. doi: 10.1186/s13027-023-00564-1. Infect Agent Cancer. 2024. PMID: 38178185 Free PMC article.
-
Longevity of companion dog breeds: those at risk from early death.Sci Rep. 2024 Feb 1;14(1):531. doi: 10.1038/s41598-023-50458-w. Sci Rep. 2024. PMID: 38302530 Free PMC article.
-
On the nonlinearity of the foreperiod effect.Sci Rep. 2024 Feb 2;14(1):2780. doi: 10.1038/s41598-024-53347-y. Sci Rep. 2024. PMID: 38307986 Free PMC article.
-
Using a theoretical approach to predict college students' non-medical use of prescription drugs - a survival analysis.J Am Coll Health. 2021 Jul;69(5):470-477. doi: 10.1080/07448481.2019.1680556. Epub 2019 Oct 29. J Am Coll Health. 2021. PMID: 31662045 Free PMC article.
References
-
- Altman DG (2003) Practical statistics for medical research. London: Chapman & Hall
-
- Clark TG, Altman DG, De Stavola BL (2002) Quantifying the completeness of follow-up. Lancet 359: 1309–1310 - PubMed
-
- Collett D (1994) Modelling Survival Data in Medical Research. London: Chapman & Hall
Publication types
MeSH terms
LinkOut - more resources
Full Text Sources
Other Literature Sources
Medical
