

Whole-genome microarrays of fission yeast: characteristics, accuracy, reproducibility, and processing of array data
- PMID: 12854975
- PMCID: PMC179895
- DOI: 10.1186/1471-2164-4-27
Whole-genome microarrays of fission yeast: characteristics, accuracy, reproducibility, and processing of array data
Abstract
Background: The genome of the fission yeast Schizosaccharomyces pombe has recently been sequenced, setting the stage for the post-genomic era of this increasingly popular model organism. We have built fission yeast microarrays, optimised protocols to improve array performance, and carried out experiments to assess various characteristics of microarrays.
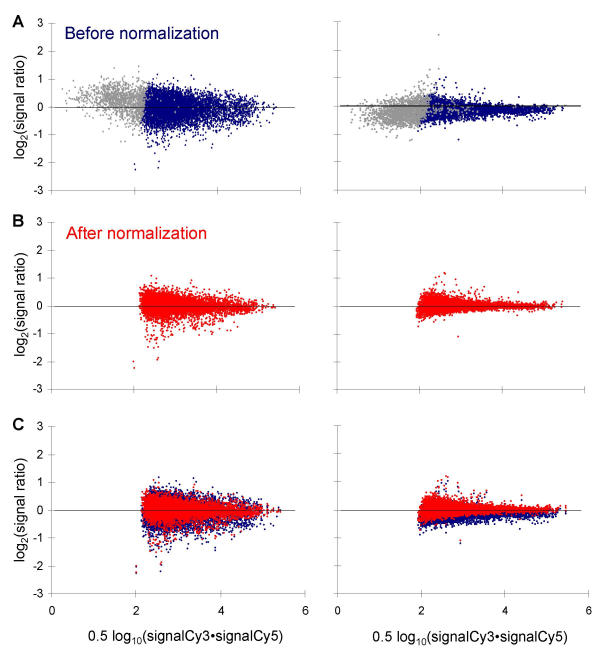
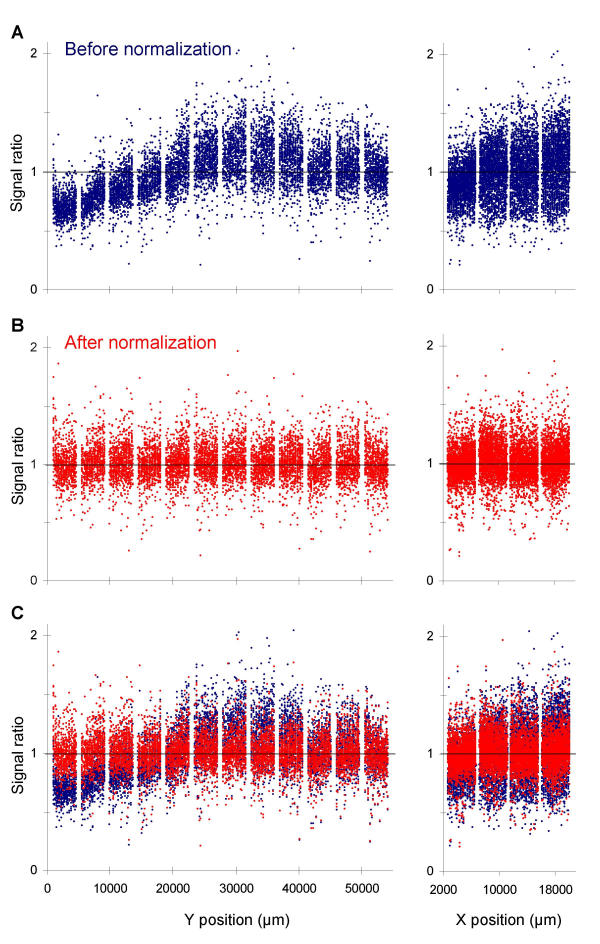
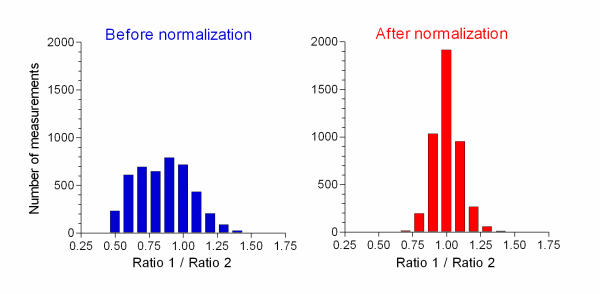
Results: We designed PCR primers to amplify specific probes (180-500 bp) for all known and predicted fission yeast genes, which are printed in duplicate onto separate regions of glass slides together with control elements (approximately 13,000 spots/slide). Fluorescence signal intensities depended on the size and intragenic position of the array elements, whereas the signal ratios were largely independent of element properties. Only the coding strand is covalently linked to the slides, and our array elements can discriminate transcriptional direction. The microarrays can distinguish sequences with up to 70% identity, above which cross-hybridisation contributes to the signal intensity. We tested the accuracy of signal ratios and measured the reproducibility of array data caused by biological and technical factors. Because the technical variability is lower, it is best to use samples prepared from independent biological experiments to obtain repeated measurements with swapping of fluorochromes to prevent dye bias. We also developed a script that discards unreliable data and performs a normalization to correct spatial artefacts.
Conclusions: This paper provides data for several microarray properties that are rarely measured. The results define critical parameters for microarray design and experiments and provide a framework to optimise and interpret array data. Our arrays give reproducible and accurate expression ratios with high sensitivity. The scripts for primer design and initial data processing as well as primer sequences and detailed protocols are available from our website.
Figures


Similar articles
-
Simplified primer design for PCR-based gene targeting and microarray primer database: two web tools for fission yeast.Yeast. 2006 Oct 15;23(13):921-8. doi: 10.1002/yea.1422. Yeast. 2006. PMID: 17072893 Free PMC article.
-
A novel design of whole-genome microarray probes for Saccharomyces cerevisiae which minimizes cross-hybridization.BMC Genomics. 2003 Sep 22;4(1):38. doi: 10.1186/1471-2164-4-38. BMC Genomics. 2003. PMID: 14499002 Free PMC article.
-
Analysis of DNA strand-specific differential expression with high density tiling microarrays.BMC Bioinformatics. 2010 Mar 17;11:136. doi: 10.1186/1471-2105-11-136. BMC Bioinformatics. 2010. PMID: 20233458 Free PMC article.
-
Production of heterologous proteins using the fission-yeast (Schizosaccharomyces pombe) expression system.Biotechnol Appl Biochem. 2009 Jun 22;53(Pt 4):227-35. doi: 10.1042/BA20090048. Biotechnol Appl Biochem. 2009. PMID: 19531030 Review.
-
Genomic profiling: cDNA arrays and oligoarrays.Methods Mol Biol. 2012;823:89-105. doi: 10.1007/978-1-60327-216-2_7. Methods Mol Biol. 2012. PMID: 22081341 Review.
Cited by
-
Condensin targets and reduces unwound DNA structures associated with transcription in mitotic chromosome condensation.Nat Commun. 2015 Jul 23;6:7815. doi: 10.1038/ncomms8815. Nat Commun. 2015. PMID: 26204128 Free PMC article.
-
The Cdc14 phosphatase, Clp1, does not affect genome expression.MicroPubl Biol. 2024 Feb 12;2024:10.17912/micropub.biology.001089. doi: 10.17912/micropub.biology.001089. eCollection 2024. MicroPubl Biol. 2024. PMID: 38415071 Free PMC article.
-
Vgl1, a multi-KH domain protein, is a novel component of the fission yeast stress granules required for cell survival under thermal stress.Nucleic Acids Res. 2010 Oct;38(19):6555-66. doi: 10.1093/nar/gkq555. Epub 2010 Jun 14. Nucleic Acids Res. 2010. PMID: 20547592 Free PMC article.
-
The more the merrier: comparative analysis of microarray studies on cell cycle-regulated genes in fission yeast.Yeast. 2006 Mar;23(4):261-277. doi: 10.1002/yea.1351. Yeast. 2006. PMID: 16544289 Free PMC article.
-
The fission yeast homeodomain protein Yox1p binds to MBF and confines MBF-dependent cell-cycle transcription to G1-S via negative feedback.PLoS Genet. 2009 Aug;5(8):e1000626. doi: 10.1371/journal.pgen.1000626. Epub 2009 Aug 28. PLoS Genet. 2009. PMID: 19714215 Free PMC article.
References
-
- Young R. Biomedical discovery with DNA arrays. Cell. 2000;102:9–16. - PubMed
-
- Schena M, Shalon D, Davis RW, Brown PO. Quantitative monitoring of gene expression patterns with a complementary DNA microarray. Science. 1995;270:467–470. - PubMed
-
- Shalon D, Smith SJ, Brown PO. A DNA microarray system for analyzing complex DNA samples using two-color fluorescent probe hybridization. Genome Res. 1996;6:639–645. - PubMed
Publication types
MeSH terms
Substances
Grants and funding
LinkOut - more resources
Full Text Sources
Other Literature Sources
