PD-1 inhibits antiviral immunity at the effector phase in the liver
- PMID: 12847136
- PMCID: PMC2196084
- DOI: 10.1084/jem.20022235
PD-1 inhibits antiviral immunity at the effector phase in the liver
Abstract
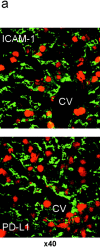
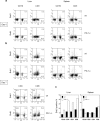
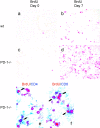
Unlike naive T cells, effector T cells can be activated by either T cell receptor signal or costimulatory signal alone and therefore the absence of costimulatory molecules on tissue cells cannot explain the tolerance mechanism at the effector phase. Here we report that PD-L1, the ligand for the immunoinhibitory receptor PD-1, was expressed on vascular endothelium in peripheral tissues. Liver nonparenchymal cells including sinusoidal endothelial cells and Kupffer cells constitutively expressed PD-L1 and inhibited proliferation and cell division of activated T cells expressing PD-1. The absence of PD-1 induced proliferation of effector T cells in the adenovirus-infected liver and resulted in rapid clearance of the virus. These results indicate that PD-1 plays an important role in T cell tolerance at the effector phase and the blockade of the PD-1 pathway can augment antiviral immunity.
Figures


Similar articles
-
PD-L2 is a second ligand for PD-1 and inhibits T cell activation.Nat Immunol. 2001 Mar;2(3):261-8. doi: 10.1038/85330. Nat Immunol. 2001. PMID: 11224527
-
Programmed cell death 1 (PD-1) and its ligand PD-L1 are required for allograft tolerance.Eur J Immunol. 2007 Oct;37(10):2983-90. doi: 10.1002/eji.200737583. Eur J Immunol. 2007. PMID: 17899549
-
Role of the programmed Death-1 pathway in the suppressive activity of alternatively activated macrophages in experimental cysticercosis.Int J Parasitol. 2005 Nov;35(13):1349-58. doi: 10.1016/j.ijpara.2005.06.003. Epub 2005 Jul 18. Int J Parasitol. 2005. PMID: 16126211
-
Structure and function of programmed death (PD) molecules.Vet Immunol Immunopathol. 2010 Mar 15;134(1-2):33-8. doi: 10.1016/j.vetimm.2009.10.006. Epub 2009 Oct 14. Vet Immunol Immunopathol. 2010. PMID: 19931186 Review.
-
The role of the PD-1 pathway in autoimmunity and peripheral tolerance.Ann N Y Acad Sci. 2011 Jan;1217:45-59. doi: 10.1111/j.1749-6632.2010.05919.x. Ann N Y Acad Sci. 2011. PMID: 21276005 Review.
Cited by
-
Liver immunology.Compr Physiol. 2013 Apr;3(2):567-98. doi: 10.1002/cphy.c120011. Compr Physiol. 2013. PMID: 23720323 Free PMC article. Review.
-
The hepatitis B virus-associated tumor microenvironment in hepatocellular carcinoma.Natl Sci Rev. 2014 Jul 14;1(3):396-412. doi: 10.1093/nsr/nwu038. Natl Sci Rev. 2014. PMID: 25741453 Free PMC article.
-
New insights on the role of human leukocyte antigen complex in primary biliary cholangitis.Front Immunol. 2022 Aug 31;13:975115. doi: 10.3389/fimmu.2022.975115. eCollection 2022. Front Immunol. 2022. PMID: 36119102 Free PMC article. Review.
-
Enhanced antiviral T cell function in the absence of B7-H1 is insufficient to prevent persistence but exacerbates axonal bystander damage during viral encephalomyelitis.J Immunol. 2010 Nov 1;185(9):5607-18. doi: 10.4049/jimmunol.1001984. Epub 2010 Sep 27. J Immunol. 2010. PMID: 20876353 Free PMC article.
-
Expression of the interleukin-7 receptor alpha chain (CD127) on virus-specific CD8+ T cells identifies functionally and phenotypically defined memory T cells during acute resolving hepatitis B virus infection.J Virol. 2006 Apr;80(7):3532-40. doi: 10.1128/JVI.80.7.3532-3540.2006. J Virol. 2006. PMID: 16537621 Free PMC article.
References
-
- Lenschow, D.J., T.L. Walunas, and J.A. Bluestone. 1996. CD28/B7 system of T cell costimulation. Annu. Rev. Immunol. 14:233–258. - PubMed
-
- Swain, S.L., M. Croft, C. Dubey, L. Haynes, P. Rogers, X. Zhang, and L.M. Bradley. 1996. From naive to memory T cells. Immunol. Rev. 150:143–167. - PubMed
-
- Dubey, C., M. Croft, and S.L. Swain. 1996. Naive and effector CD4 T cells differ in their requirements for T cell receptor versus costimulatory signals. J. Immunol. 157:3280–3289. - PubMed
-
- Mullbacher, A., and K. Flynn. 1996. Aspects of cytotoxic T cell memory. Immunol. Rev. 150:113–127. - PubMed
-
- Flynn, K., and A. Mullbacher. 1997. The generation of memory antigen-specific cytotoxic T cell responses by CD28/CD80 interactions in the absence of antigen. Eur. J. Immunol. 27:456–462. - PubMed
Publication types
MeSH terms
Substances
LinkOut - more resources
Full Text Sources
Other Literature Sources
Medical
Molecular Biology Databases
Research Materials

