. 2003 Jun;14(6):2277-91.
doi: 10.1091/mbc.e02-10-0697. Epub 2003 Apr 4.

Tomographic evidence for continuous turnover of Golgi cisternae in Pichia pastoris

Affiliations

Tomographic evidence for continuous turnover of Golgi cisternae in Pichia pastoris

Soren Mogelsvang et al. Mol Biol Cell. 2003 Jun.

Abstract

The budding yeast Pichia pastoris contains ordered Golgi stacks next to discrete transitional endoplasmic reticulum (tER) sites, making this organism ideal for structure-function studies of the secretory pathway. Here, we have used P. pastoris to test various models for Golgi trafficking. The experimental approach was to analyze P. pastoris tER-Golgi units by using cryofixed and freeze-substituted cells for electron microscope tomography, immunoelectron microscopy, and serial thin section analysis of entire cells. We find that tER sites and the adjacent Golgi stacks are enclosed in a ribosome-excluding "matrix." Each stack contains three to four cisternae, which can be classified as cis, medial, trans, or trans-Golgi network (TGN). No membrane continuities between compartments were detected. This work provides three major new insights. First, two types of transport vesicles accumulate at the tER-Golgi interface. Morphological analysis indicates that the center of the tER-Golgi interface contains COPII vesicles, whereas the periphery contains COPI vesicles. Second, fenestrae are absent from cis cisternae, but are present in medial through TGN cisternae. The number and distribution of the fenestrae suggest that they form at the edges of the medial cisternae and then migrate inward. Third, intact TGN cisternae apparently peel off from the Golgi stacks and persist for some time in the cytosol, and these "free-floating" TGN cisternae produce clathrin-coated vesicles. These observations are most readily explained by assuming that Golgi cisternae form at the cis face of the stack, progressively mature, and ultimately dissociate from the trans face of the stack.


Figures
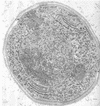
Figure 1.
Figure 1.
Electron micrograph of a high-pressure frozen and freeze substituted P. pastoris cell. Golgi stacks and tER sites are clearly defined with discernible membrane bilayers. The Golgi stacks have a clear polarity in this OsO4-stained material, with the cis cisternae staining faintly and the trans cisternae staining intensely. The trans and TGN cisternae seem to have fenestrae. CW, cell wall; M, mitochondrion; N, nucleus; arrows, vesicles. Bar, 100 nm.
Figure 2.
Figure 2.
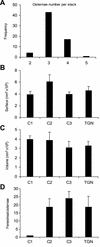
Quantitative data from the serial thin section analysis and the tomographic 3D models. (A) The number of cisternae per Golgi stack was counted in 67 stacks. Electron micrographs of serial ultrathin sections were used to ensure that all cisternae were counted. The majority of the stacks have three or four cisternae. (B–D) These values are averages of data from three reconstructed Golgi stacks, two of which are shown in Figures 8 and 9. (B and C) The surface areas and volumes of individual cisternae were calculated using the IMOD software. Interpolated gaps were not included and the truncated edges added to the uncertainty. Despite these caveats, the data reveal no significant change in either surface area or volume across the stacks. (D) The number of fenestrae increases dramatically from C1 to C2, but stays relatively constant across the rest of the stack. The error bars indicate SD.
Figure 3.
Figure 3.
Immunofluorescence localization of Och1p-myc and Sec7p-GFP. Each panel shows the same cells with the indicated markers. The cis marker Och1p-myc and the trans/TGN marker Sec7p-GFP are adjacent, but not completely overlapping. Bar, 2 μm.
Figure 4.
Figure 4.
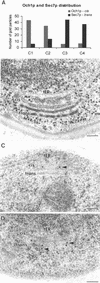
Localization of Och1p-myc and Sec7p-GFP by immunoelectron microscopy. (A) Summary of the immunolocalization studies. Och1p-myc labeling was quantified on 37 random stacks and Sec7p-GFP labeling was quantified on 33 random stacks. Och1p-myc localizes to the cis side and Sec7p-GFP to the trans side of the stacks. (B) Electron micrograph of an Epon section illustrating a tER site and a Golgi stack for reference. (C) Electron micrograph of an HM20 section showing a tER site and a Golgi stack with immunogold-labeled Och1p-myc on the cis side. (D) Electron micrograph of an HM20 section showing a Golgi stack with immunogold-labeled Sec7p-GFP at the trans side. Bar, 100 nm.
Figure 5.
Figure 5.
A tomographic slice from a dual-axis tomogram of a cell volume containing a tER site and a Golgi stack. The same 2.3-nm-thick slice is shown in A and B. The tomogram comprised a total of 257 optical slices, which corresponds to a 0.6-μm-thick cell volume. All of the tomographic slices of this tomogram are shown in Movie 1. (A) In the tomogram, the appearance of the Golgi cisternae and membrane bilayers is similar to that seen in conventional ultrathin sections (compare with Figure 1). (B) The tomographic data were analyzed by tracing membranes of interest in all of the slices of the tomogram. Bar, 100 nm.
Figure 6.
Figure 6.
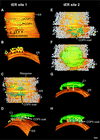
3D models of two tER sites. (A–D) Different views of a tER site with budding profiles and associated free vesicles. (E–H) A second tER site and its associated structures. (A and B) Two classes of vesicles are found between the tER site and the C1 cisterna. The larger vesicles have a diameter of ∼42 nm and a lightly staining lumen and are sometimes coated with a proteinaceous material similar to that on the budding tER profiles (Figure 7). We propose that these structures are anterograde vesicles and that the coat is composed of COPII components. The smaller vesicles have a diameter of ∼34 nm and a darkly staining lumen and are sometimes seen outside the tER-Golgi interface (Figures 7 and 8). We propose that these structures are retrograde COPI vesicles. (C and E) The tER sites are outlined by a ribosome-excluding zone. (D, F, G, and H) The C1 cisternae are very close to the tER sites, confining the movement of the free vesicles to this space. (G) Side view of a tER-associated budding vesicle and a budding/fusing structure on the C1 cisterna. Bar, 100 nm.
Figure 8.
Figure 8.
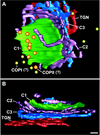
3D model of a P. pastoris Golgi stack and associated vesicles. A and B are two different views of the same Golgi stack. The model represents the Golgi stack shown in Figure 5 and was generated by rendering a surface fit to the traced contours. This stack has four cisternae. An interesting feature is the tubule from the margin of C2 that reaches around the C1 cisterna. Bar, 100 nm.
Figure 7.
Figure 7.
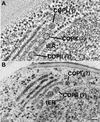
Tomographic and electron micrographic images of tER sites. (A) A tomographic slice from a dual-axis tomogram showing a tER site. (B) Electron micrograph showing a tER site similar to that in A. Both A and B show the presence of two different vesicles types at the tER-Golgi interface. The putative COPII vesicles have lightly stained lumens, whereas the putative COPI vesicles have darkly stained lumens. Bar, 100 nm.
Figure 9.
Figure 9.
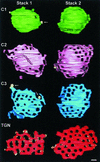
Face-on view of the individual cisternae of two P. pastoris Golgi stacks, seen from the cis side. Stack 1 is the same as in Figure 8. Protein coats are shown in bright yellow. The C1 cisternae are smaller in diameter than the other cisternae. Each of the C1 cisternae shown here has one fenestra, whereas the C2 to TGN cisternae have multiple fenestrae. The fenestrae seem to form a narrow ring in the C2 cisternae and a wider ring in the C3 cisternae and are found throughout the TGN cisternae, which resemble networks. Tubules protrude from the margins of C2 and to a lesser extent from C3. The TGN has a protein coat, perhaps Golgi matrix proteins, distributed over its surface. Arrows, budding profiles. Bar, 100 nm.
Figure 11.
Figure 11.
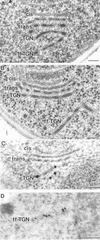
Electron micrographs of ultrathin sections showing Golgi stacks or cisternae. (A and B) Sections of Epon samples showing two different stages of TGN dissociation from the parental stack. (C and D) HM20 sections with immunogold labeling of the trans/TGN marker protein Sec7p-GFP. In C the labeled cisternae seem to be peeling off from the stack, equivalent to the situation in A. (D) ff-TGN structure with Sec7p-GFP labeling, indicating that these structures can carry resident Golgi proteins after dissociating from the stack. Bar, 100 nm.
Figure 14.
Figure 14.
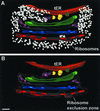
View showing a slice of a reconstructed P. pastoris Golgi stack. (A) Ribosomes are excluded from the spaces between the cisternae and the tER-Golgi interface. (B) Same stack as in A, but with the border of the ribosome-excluding zone outlined. Note how the ribosomes penetrate a large fenestra in the red TGN cisterna. Bar, 100 nm.
Figure 10.
Figure 10.
Side view of a P. pastoris Golgi stack. The TGN cisterna seems to be in the process of dissociating from the stack. Bar, 100 nm.
Figure 12.
Figure 12.
3D model of an entire P. pastoris cell. The model is based on serial thin-section reconstruction and shows Golgi stacks, tER sites, ff-TGNs, secretory vesicles (SV), the nucleus (faint red), and the vacuole (faint blue). The ff-TGNs are all near Golgi stacks rather than being randomly distributed throughout the cytoplasm. Note that the secretory vesicles are concentrated toward the emerging bud.
Figure 13.
Figure 13.
Electron micrograph showing the apparent association of clathrin-coated vesicles with a ff-TGN. N, nucleus. Bar, 100 nm.
Figure 15.
Figure 15.
Interpretive model of the structural organization of P. pastoris tER sites and Golgi stacks. See the text for details.

Similar articles

Cited by

References

    1. Bannykh, S.I., and Balch, W.E. (1997). Membrane dynamics at the endoplasmic reticulum Golgi interface. J. Cell Biol. 138, 1-4. - PMC - PubMed
    1. Bannykh, S.I., Rowe, T., and Balch, W.E. (1996). The organization of endoplasmic reticulum export complexes. J. Cell Biol. 135, 19-35. - PMC - PubMed
    1. Barlowe, C. (2002). COPII-dependent transport from the endoplasmic reticulum. Curr. Opin. Cell Biol. 14, 417-422. - PubMed
    1. Barr, F.A., Preisinger, C., Kopajtich, R., and Korner, R. (2001). Golgi matrix proteins interact with p24 cargo receptors and aid their efficient retention in the Golgi apparatus. J. Cell Biol. 155, 885-891. - PMC - PubMed
    1. Berger, E.G., and Roth, J.P.D.D. (1997). The Golgi Apparatus. Boston: Birkhäuser Verlag.

Publication types

LinkOut - more resources