

Turnover of env variable region 1 and 2 genotypes in subjects with late-stage human immunodeficiency virus type 1 infection
- PMID: 12768001
- PMCID: PMC156159
- DOI: 10.1128/jvi.77.12.6811-6822.2003
Turnover of env variable region 1 and 2 genotypes in subjects with late-stage human immunodeficiency virus type 1 infection
Abstract
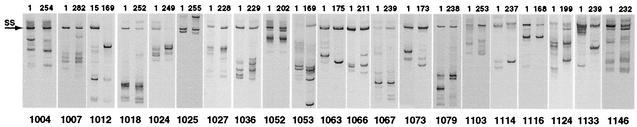
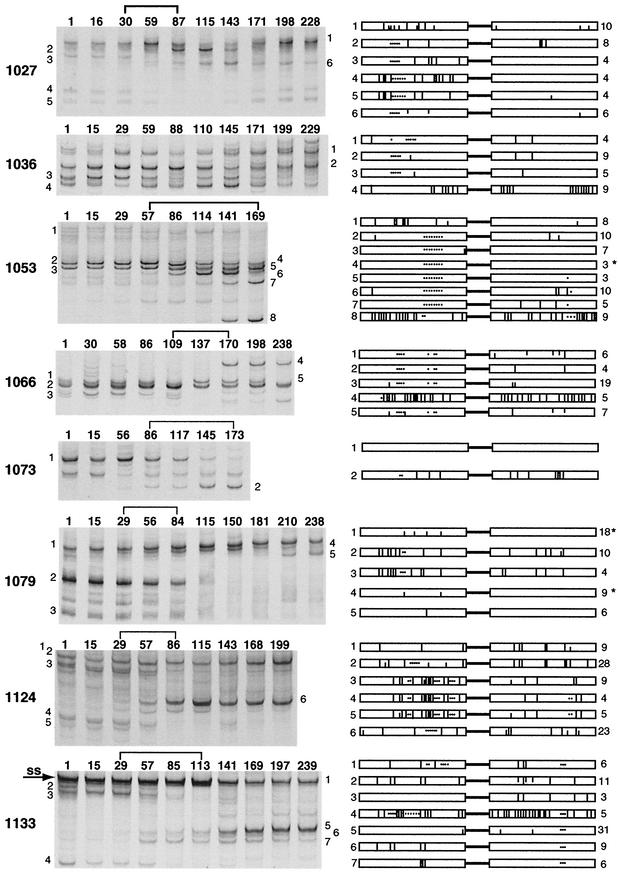
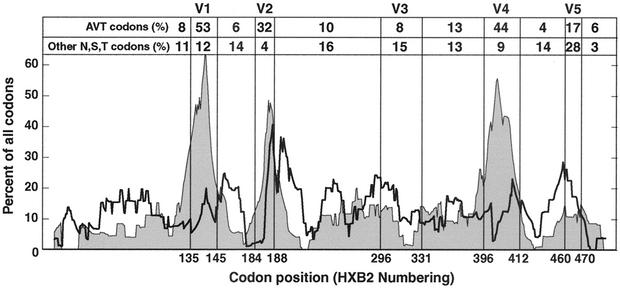
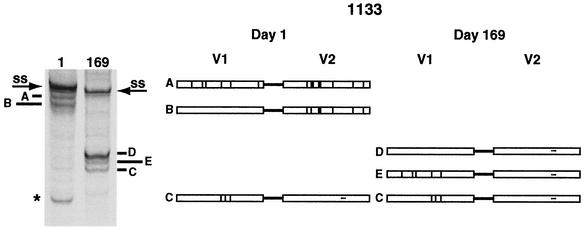
The env gene of human immunodeficiency virus type 1 (HIV-1) includes some of the most genetically diverse regions of the viral genome, which are called variable regions 1 through 5 (V1 through V5). We have developed a heteroduplex tracking assay to detect changes in variable regions 1 and 2 of env (V1/V2-HTA). Using sequences from two molecular clones as probes, we have studied the nature of longitudinal virus population changes in a cohort of HIV-1-infected subjects. Viral sequences present in 21 subjects with late-stage HIV-1 infection were initially screened for stability of the virus population by V1/V2-HTA. The virus populations at entry comprised an average of five coexisting V1/V2 genotypic variants (as identified by HTA). Eight of the 21 subjects were examined in detail because of the dynamic behavior of their env variants over an approximately 9-month period. In each of these cases we detected a single discrete transition of V1/V2 genotypes based on monthly sampling. The major V1/V2 genotypes (those present at >10% abundance) from the eight subjects were cloned and sequenced to define the nature of V1/V2 variability associated with a discrete transition. Based on a comparison of V1/V2 genotypic variants present at entry with the newly emerged variants we categorized the newly emerged variants into two groups: variants without length differences and variants with length differences. Variants without length differences had fewer nucleotide substitutions, with the changes biased to either V1 or V2, suggestive of recent evolutionary events. Variants with length differences included ones with larger numbers of changes that were distributed, suggestive of recall of older genotypes. Most length differences were located in domains where the codon motif AVT (V = A, G, C) had become enriched and fixed. Finally, recombination events were detected in two subjects, one of which resulted in the reassortment of V1 and V2 regions. We suggest that turnover in V1/V2 populations was largely driven by selection on either V1 or V2 and that escape was accomplished either through changes focused in the region under selection or by the appearance of a highly divergent variant.
Figures


Similar articles
-
Multiple V1/V2 env variants are frequently present during primary infection with human immunodeficiency virus type 1.J Virol. 2004 Oct;78(20):11208-18. doi: 10.1128/JVI.78.20.11208-11218.2004. J Virol. 2004. PMID: 15452240 Free PMC article.
-
The molecular epidemiology of HIV-1 envelope diversity during HIV-1 subtype C vertical transmission in Malawian mother-infant pairs.AIDS. 2008 Apr 23;22(7):863-71. doi: 10.1097/QAD.0b013e3282f51ea0. AIDS. 2008. PMID: 18427205 Free PMC article.
-
Sequential turnover of human immunodeficiency virus type 1 env throughout the course of infection.J Virol. 2006 Nov;80(21):10591-9. doi: 10.1128/JVI.00644-06. Epub 2006 Sep 6. J Virol. 2006. PMID: 16956948 Free PMC article.
-
Envelope sequence variation, neutralizing antibodies, and primate lentivirus persistence.Curr Top Microbiol Immunol. 1994;188:185-219. doi: 10.1007/978-3-642-78536-8_11. Curr Top Microbiol Immunol. 1994. PMID: 7523031 Review.
-
Using HIV-1 sequence variability to explore virus biology.Virus Res. 2001 Aug;76(2):137-60. doi: 10.1016/s0168-1702(01)00271-4. Virus Res. 2001. PMID: 11410314 Review.
Cited by
-
Estimating true antimalarial efficacy by heteroduplex tracking assay in patients with complex Plasmodium falciparum infections.Antimicrob Agents Chemother. 2007 Feb;51(2):521-7. doi: 10.1128/AAC.00902-06. Epub 2006 Nov 20. Antimicrob Agents Chemother. 2007. PMID: 17116685 Free PMC article. Clinical Trial.
-
Sequencing-based detection of low-frequency human immunodeficiency virus type 1 drug-resistant mutants by an RNA/DNA heteroduplex generator-tracking assay.J Virol. 2004 Jul;78(13):7112-23. doi: 10.1128/JVI.78.13.7112-7123.2004. J Virol. 2004. PMID: 15194787 Free PMC article.
-
Compartmentalization of human immunodeficiency virus type 1 between blood monocytes and CD4+ T cells during infection.J Virol. 2004 Aug;78(15):7883-93. doi: 10.1128/JVI.78.15.7883-7893.2004. J Virol. 2004. PMID: 15254161 Free PMC article.
-
Vaccine induced antibodies to the first variable loop of human immunodeficiency virus type 1 gp120, mediate antibody-dependent virus inhibition in macaques.Vaccine. 2011 Dec 9;30(1):78-94. doi: 10.1016/j.vaccine.2011.10.040. Epub 2011 Oct 27. Vaccine. 2011. PMID: 22037204 Free PMC article.
-
Evidence for the acquisition of multi-drug resistance in an HIV-1 clinical isolate via human sequence transduction.Virology. 2006 Jul 20;351(1):1-6. doi: 10.1016/j.virol.2006.05.009. Epub 2006 Jun 14. Virology. 2006. PMID: 16777167 Free PMC article.
References
-
- Barrie, K. A., E. E. Perez, S. L. Lamers, W. G. Farmerie, B. M. Dunn, J. W. Sleasman, and M. M. Goodenow. 1996. Natural variation in HIV-1 protease, Gag p7 and p6, and protease cleavage sites within gag/pol polyproteins: amino acid substitutions in the absence of protease inhibitors in mothers and children infected by human immunodeficiency virus type 1. Virology 219:407-416. - PubMed
-
- Cameron, D. W., M. Heath-Chiozzi, S. Danner, C. Cohen, S. Kravcik, C. Maurath, E. Sun, D. Henry, R. Rode, A. Potthoff, and J. Leonard. 1998. Randomised placebo-controlled trial of ritonavir in advanced HIV-1 disease. Lancet 351:543-549. - PubMed
Publication types
MeSH terms
Substances
Associated data
- Actions
- Actions
- Actions
- Actions
- Actions
- Actions
- Actions
- Actions
- Actions
- Actions
- Actions
- Actions
- Actions
- Actions
- Actions
- Actions
- Actions
- Actions
- Actions
- Actions
- Actions
- Actions
- Actions
- Actions
- Actions
- Actions
- Actions
- Actions
- Actions
- Actions
- Actions
- Actions
- Actions
- Actions
- Actions
- Actions
- Actions
- Actions
- Actions
- Actions
- Actions
- Actions
- Actions
- Actions
- Actions
- Actions
- Actions
- Actions
- Actions
- Actions
- Actions
- Actions
- Actions
- Actions
- Actions
- Actions
- Actions
- Actions
- Actions
- Actions
- Actions
- Actions
- Actions
- Actions
- Actions
- Actions
- Actions
- Actions
- Actions
- Actions
- Actions
- Actions
- Actions
- Actions
- Actions
- Actions
- Actions
- Actions
- Actions
- Actions
- Actions
- Actions
- Actions
- Actions
- Actions
- Actions
- Actions
- Actions
- Actions
- Actions
- Actions
- Actions
- Actions
- Actions
- Actions
- Actions
- Actions
- Actions
- Actions
- Actions
- Actions
- Actions
- Actions
- Actions
- Actions
- Actions
- Actions
- Actions
- Actions
- Actions
- Actions
- Actions
- Actions
- Actions
- Actions
- Actions
- Actions
- Actions
- Actions
- Actions
- Actions
- Actions
- Actions
- Actions
- Actions
- Actions
- Actions
- Actions
- Actions
- Actions
- Actions
- Actions
- Actions
- Actions
- Actions
- Actions
- Actions
- Actions
- Actions
- Actions
- Actions
- Actions
- Actions
- Actions
- Actions
- Actions
- Actions
- Actions
- Actions
- Actions
- Actions
- Actions
- Actions
- Actions
- Actions
- Actions
- Actions
- Actions
- Actions
- Actions
- Actions
- Actions
- Actions
- Actions
- Actions
- Actions
- Actions
- Actions
- Actions
- Actions
- Actions
- Actions
- Actions
- Actions
- Actions
- Actions
- Actions
- Actions
- Actions
- Actions
- Actions
- Actions
- Actions
- Actions
- Actions
- Actions
- Actions
- Actions
- Actions
- Actions
- Actions
- Actions
- Actions
- Actions
- Actions
- Actions
- Actions
- Actions
- Actions
- Actions
- Actions
- Actions
- Actions
- Actions
- Actions
- Actions
- Actions
- Actions
- Actions
- Actions
- Actions
- Actions
- Actions
- Actions
- Actions
- Actions
- Actions
- Actions
- Actions
- Actions
- Actions
- Actions
- Actions
- Actions
- Actions
- Actions
- Actions
- Actions
- Actions
- Actions
- Actions
- Actions
- Actions
- Actions
- Actions
- Actions
- Actions
- Actions
- Actions
- Actions
- Actions
- Actions
- Actions
- Actions
- Actions
- Actions
- Actions
- Actions
- Actions
- Actions
- Actions
- Actions
- Actions
- Actions
- Actions
- Actions
- Actions
- Actions
- Actions
- Actions
- Actions
- Actions
- Actions
- Actions
- Actions
- Actions
- Actions
- Actions
- Actions
- Actions
- Actions
- Actions
- Actions
- Actions
- Actions
- Actions
- Actions
- Actions
- Actions
- Actions
- Actions
- Actions
- Actions
- Actions
- Actions
- Actions
- Actions
- Actions
- Actions
- Actions
- Actions
- Actions
- Actions
- Actions
- Actions
- Actions
- Actions
- Actions
- Actions
- Actions
- Actions
- Actions
- Actions
- Actions
- Actions
- Actions
- Actions
- Actions
- Actions
- Actions
- Actions
- Actions
- Actions
- Actions
- Actions
- Actions
- Actions
- Actions
- Actions
- Actions
- Actions
- Actions
- Actions
- Actions
- Actions
- Actions
- Actions
- Actions
- Actions
- Actions
- Actions
- Actions
- Actions
- Actions
- Actions
- Actions
- Actions
- Actions
- Actions
- Actions
- Actions
- Actions
- Actions
- Actions
- Actions
- Actions
- Actions
- Actions
- Actions
- Actions
- Actions
- Actions
- Actions
- Actions
- Actions
- Actions
- Actions
- Actions
- Actions
Grants and funding
LinkOut - more resources
Full Text Sources
Other Literature Sources
Medical
Molecular Biology Databases
