Ribavirin treatment up-regulates antiviral gene expression via the interferon-stimulated response element in respiratory syncytial virus-infected epithelial cells
- PMID: 12719586
- PMCID: PMC154027
- DOI: 10.1128/jvi.77.10.5933-5947.2003
Ribavirin treatment up-regulates antiviral gene expression via the interferon-stimulated response element in respiratory syncytial virus-infected epithelial cells
Abstract
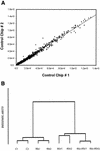
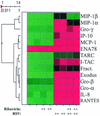
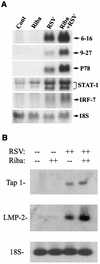
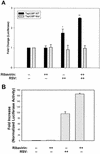
Respiratory syncytial virus (RSV) is a mucosa-restricted virus that is a leading cause of epidemic respiratory tract infections in children. RSV replication is a potent activator of the epithelial-cell genomic response, influencing the expression of a spectrum of cellular pathways, including proinflammatory chemokines of the CC, CXC, and CX(3)C subclasses. Ribavirin (1-beta-D-ribofuranosyl-1,2,4-triazole-3-carboxamide) is a nontoxic antiviral agent currently licensed for the treatment of severe RSV lower respiratory tract infections. Because ribavirin treatment reduces the cytopathic effect in infected cells, we used high-density microarrays to investigate the hypothesis that ribavirin modifies the virus-induced epithelial genomic response to replicating virus. Ribavirin treatment administered in concentrations of 10 to 100 micro g/ml potently inhibited RSV transcription, thereby reducing the level of RSV N transcripts to approximately 13% of levels in nontreated cells. We observed that in both the absence and the presence of ribavirin, RSV infection induced global alterations in the host epithelial cell, affecting approximately 49% of the approximately 6,650 expressed genes detectable by the microarray. Ribavirin influences the expression of only 7.5% of the RSV-inducible genes (total number of genes, 272), suggesting that the epithelial-cell genetic program initiated by viral infection is independent of high-level RSV replication. Hierarchical clustering of the ribavirin-regulated genes identified four expression patterns. In one group, ribavirin inhibited the expression of the RSV-inducible CC chemokines MIP-1 alpha and -1 beta, which are important in RSV-induced pulmonary pathology, and interferon (IFN), a cytokine important in the mucosal immune response. In a second group, ribavirin further up-regulated a set of RSV- and IFN-stimulated response genes (ISGs) encoding antiviral proteins (MxA and p56), complement products, acute-phase response factors, and the STAT and IRF transcription factors. Because IFN-beta expression itself was reduced in the ribavirin-treated cells, we further investigated the mechanism for up-regulation of the IFN-signaling pathway. Enhanced expression of IFI 6-16, IFI 9-27, MxA/p78, STAT-1 alpha, STAT-1 beta, IRF-7B, and TAP-1-LMP2 transcripts were independently reproduced by Northern blot analysis. Ribavirin-enhanced TAP-1-LMP2 expression was a transcriptional event where site mutations of the IFN-stimulated response element (ISRE) blocked RSV and ribavirin-inducible promoter activity. Furthermore, ribavirin up-regulated the transcriptional activity of a reporter gene selectively driven by the ISRE. In specific DNA pull-down assays, we observed that ribavirin enhanced RSV-induced STAT-1 binding to the ISRE. We conclude that ribavirin potentiates virus-induced ISRE signaling to enhance the expression of antiviral ISGs, suggesting a mechanism for the efficacy of combined treatment with ribavirin and IFN in other chronic viral diseases.
Figures


Similar articles
-
Expression of respiratory syncytial virus-induced chemokine gene networks in lower airway epithelial cells revealed by cDNA microarrays.J Virol. 2001 Oct;75(19):9044-58. doi: 10.1128/JVI.75.19.9044-9058.2001. J Virol. 2001. PMID: 11533168 Free PMC article.
-
Retinoic acid-inducible gene I mediates early antiviral response and Toll-like receptor 3 expression in respiratory syncytial virus-infected airway epithelial cells.J Virol. 2007 Feb;81(3):1401-11. doi: 10.1128/JVI.01740-06. Epub 2006 Nov 15. J Virol. 2007. PMID: 17108032 Free PMC article.
-
BRD4 Couples NF-κB/RelA with Airway Inflammation and the IRF-RIG-I Amplification Loop in Respiratory Syncytial Virus Infection.J Virol. 2017 Feb 28;91(6):e00007-17. doi: 10.1128/JVI.00007-17. Print 2017 Mar 15. J Virol. 2017. PMID: 28077651 Free PMC article.
-
Understanding the molecular mechanism(s) of hepatitis C virus (HCV) induced interferon resistance.Infect Genet Evol. 2013 Oct;19:113-9. doi: 10.1016/j.meegid.2013.06.025. Epub 2013 Jul 5. Infect Genet Evol. 2013. PMID: 23831932 Review.
-
Function and Modulation of Type I Interferons during Respiratory Syncytial Virus Infection.Vaccines (Basel). 2020 Apr 10;8(2):177. doi: 10.3390/vaccines8020177. Vaccines (Basel). 2020. PMID: 32290326 Free PMC article. Review.
Cited by
-
Epimedium koreanum Nakai Water Extract Exhibits Antiviral Activity against Porcine Epidermic Diarrhea Virus In Vitro and In Vivo.Evid Based Complement Alternat Med. 2012;2012:985151. doi: 10.1155/2012/985151. Epub 2012 Nov 29. Evid Based Complement Alternat Med. 2012. PMID: 23259003 Free PMC article.
-
Counteracting quasispecies adaptability: extinction of a ribavirin-resistant virus mutant by an alternative mutagenic treatment.PLoS One. 2009;4(5):e5554. doi: 10.1371/journal.pone.0005554. Epub 2009 May 14. PLoS One. 2009. PMID: 19436746 Free PMC article.
-
Immunological aspects of antiviral therapy of chronic hepatitis B virus and hepatitis C virus infections.Hepatology. 2015 Feb;61(2):712-21. doi: 10.1002/hep.27323. Hepatology. 2015. PMID: 25048716 Free PMC article. Review.
-
Lethal Mutagenesis of Hepatitis C Virus Induced by Favipiravir.PLoS One. 2016 Oct 18;11(10):e0164691. doi: 10.1371/journal.pone.0164691. eCollection 2016. PLoS One. 2016. PMID: 27755573 Free PMC article.
-
Development of antiviral therapy for severe acute respiratory syndrome.Antiviral Res. 2005 Jun;66(2-3):81-97. doi: 10.1016/j.antiviral.2005.03.002. Epub 2005 Apr 26. Antiviral Res. 2005. PMID: 15878786 Free PMC article. Review.
References
-
- Adler, K. B., B. M. Fischer, D. T. Wright, L. A. Cohn, and S. Becker. 1994. Interactions between respiratory epithelial cells and cytokines: relationships to lung inflammation. Ann. N. Y. Acad. Sci. 725:128-145. - PubMed
-
- Atreya, P. L., and S. Kulkarni. 1999. Respiratory syncytial virus strain A2 is resistant to the antiviral effects of type I interferons and human MxA. Virology 261:227-241. - PubMed
-
- Barnes, P. J., and M. Karin. 1997. Nuclear factor-kappaB: a pivotal transcription factor in chronic inflammatory diseases. N. Engl. J. Med. 336:1066-1071. - PubMed
-
- Becker, S., W. Reed, F. W. Henderson, and T. L. Noah. 1997. RSV infection of human airway epithelial cells causes production of the β-chemokine RANTES. Am. J. Physiol. 272:L512-L520. - PubMed
Publication types
MeSH terms
Substances
Grants and funding
LinkOut - more resources
Full Text Sources
Other Literature Sources
Research Materials
Miscellaneous

