

Longitudinal magnetic resonance imaging studies of older adults: a shrinking brain
- PMID: 12716936
- PMCID: PMC6742337
- DOI: 10.1523/JNEUROSCI.23-08-03295.2003
Longitudinal magnetic resonance imaging studies of older adults: a shrinking brain
Abstract
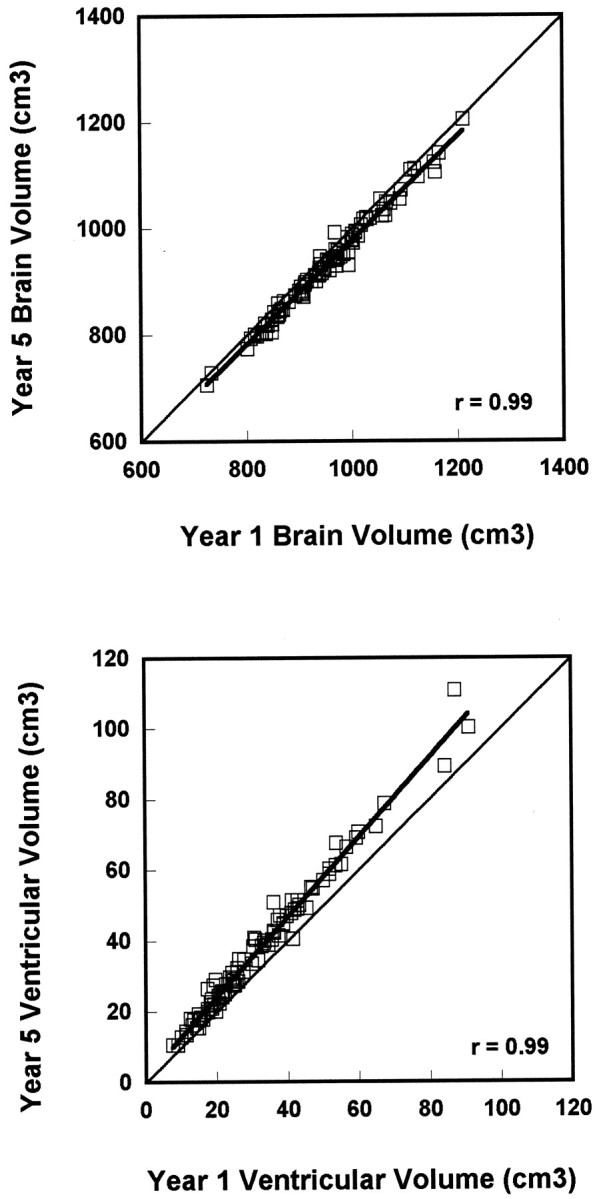
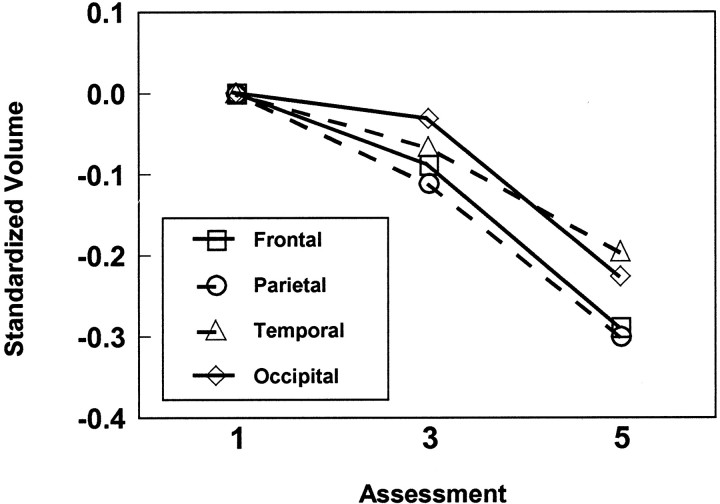
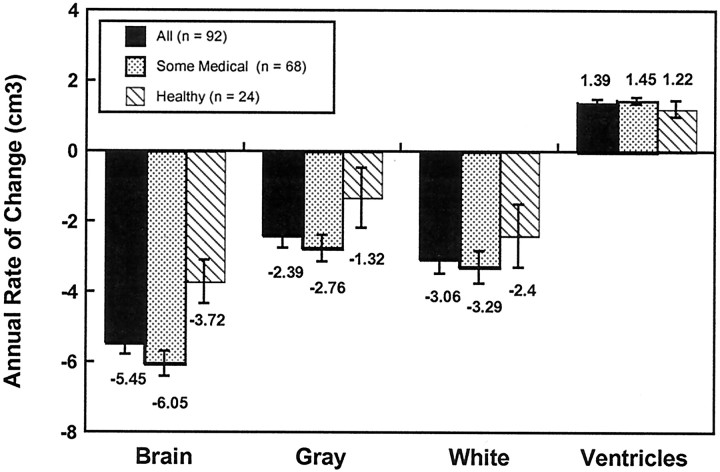
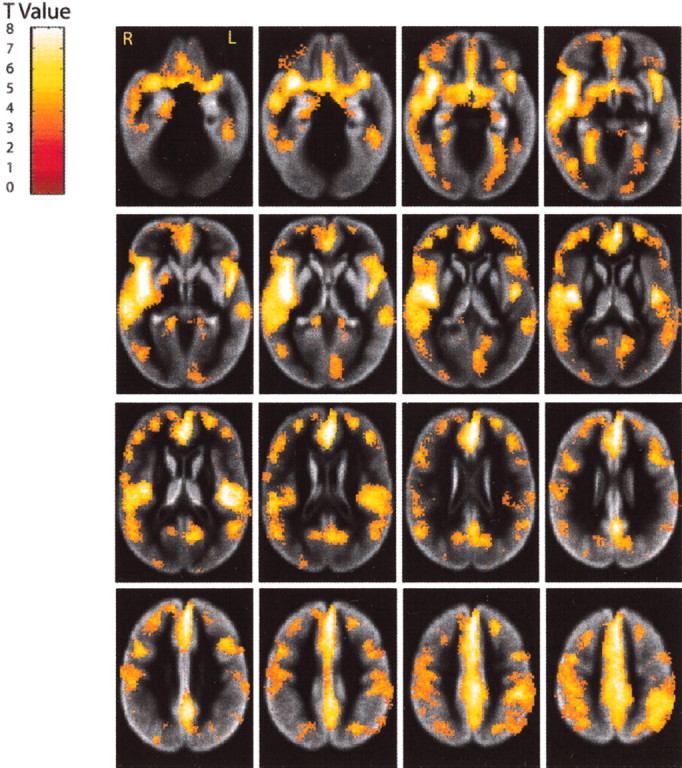
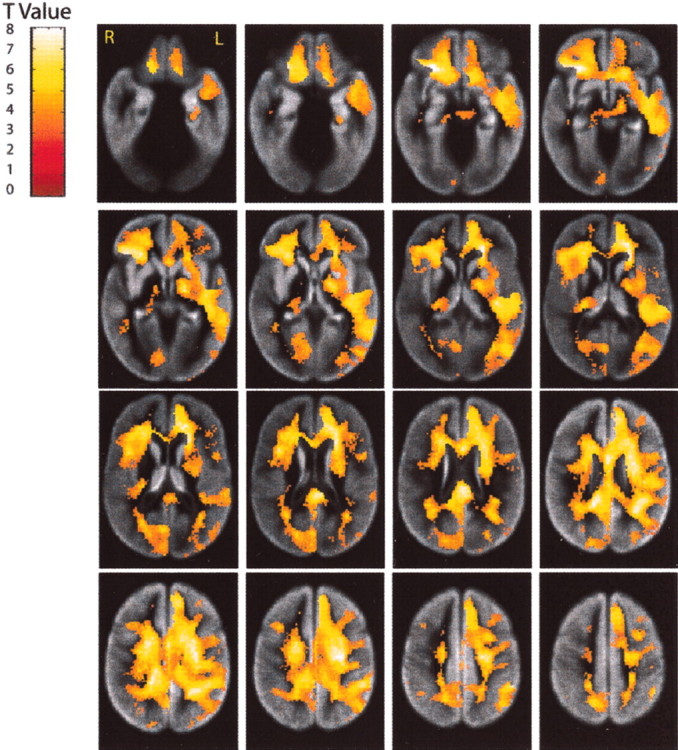
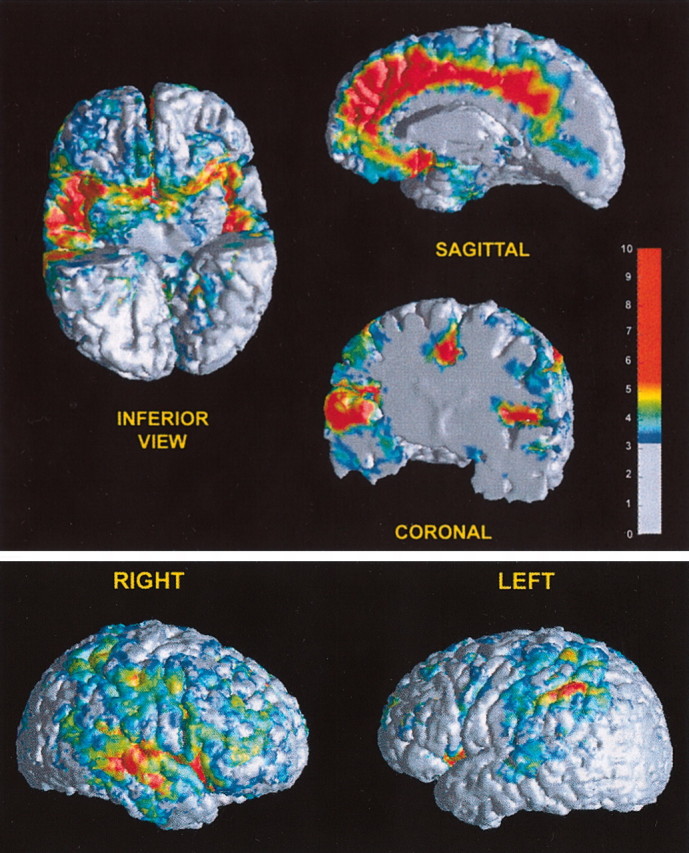
Age-related loss of brain tissue has been inferred from cross-sectional neuroimaging studies, but direct measurements of gray and white matter changes from longitudinal studies are lacking. We quantified longitudinal magnetic resonance imaging (MRI) scans of 92 nondemented older adults (age 59-85 years at baseline) in the Baltimore Longitudinal Study of Aging to determine the rates and regional distribution of gray and white matter tissue loss in older adults. Using images from baseline, 2 year, and 4 year follow-up, we found significant age changes in gray (p < 0.001) and white (p < 0.001) volumes even in a subgroup of 24 very healthy elderly. Annual rates of tissue loss were 5.4 +/- 0.3, 2.4 +/- 0.4, and 3.1 +/- 0.4 cm3 per year for total brain, gray, and white volumes, respectively, and ventricles increased by 1.4 +/- 0.1 cm3 per year (3.7, 1.3, 2.4, and 1.2 cm3, respectively, in very healthy). Frontal and parietal, compared with temporal and occipital, lobar regions showed greater decline. Gray matter loss was most pronounced for orbital and inferior frontal, cingulate, insular, inferior parietal, and to a lesser extent mesial temporal regions, whereas white matter changes were widespread. In this first study of gray and white matter volume changes, we demonstrate significant longitudinal tissue loss for both gray and white matter even in very healthy older adults. These data provide essential information on the rate and regional pattern of age-associated changes against which pathology can be evaluated and suggest slower rates of brain atrophy in individuals who remain medically and cognitively healthy.
Figures
Similar articles
-
One-year age changes in MRI brain volumes in older adults.Cereb Cortex. 2000 May;10(5):464-72. doi: 10.1093/cercor/10.5.464. Cereb Cortex. 2000. PMID: 10847596
-
Measuring the effects of aging and sex on regional brain stiffness with MR elastography in healthy older adults.Neuroimage. 2015 May 1;111:59-64. doi: 10.1016/j.neuroimage.2015.02.016. Epub 2015 Feb 17. Neuroimage. 2015. PMID: 25698157 Free PMC article.
-
Normative estimates of cross-sectional and longitudinal brain volume decline in aging and AD.Neurology. 2005 Mar 22;64(6):1032-9. doi: 10.1212/01.WNL.0000154530.72969.11. Neurology. 2005. PMID: 15781822
-
Genetic influences on human brain structure: a review of brain imaging studies in twins.Hum Brain Mapp. 2007 Jun;28(6):464-73. doi: 10.1002/hbm.20398. Hum Brain Mapp. 2007. PMID: 17415783 Free PMC article. Review.
-
How does the brain age in individuals with multiple sclerosis? A systematic review.Front Neurol. 2023 Jun 30;14:1207626. doi: 10.3389/fneur.2023.1207626. eCollection 2023. Front Neurol. 2023. PMID: 37456635 Free PMC article. Review.
Cited by
-
An Open-Source Label Atlas Correction Tool and Preliminary Results on Huntingtons Disease Whole-Brain MRI Atlases.Front Neuroinform. 2016 Aug 3;10:29. doi: 10.3389/fninf.2016.00029. eCollection 2016. Front Neuroinform. 2016. PMID: 27536233 Free PMC article.
-
Early and Late Shift of Brain Laterality in STG, HG, and Cerebellum with Normal Aging during a Short-Term Memory Task.ISRN Neurol. 2013;2013:892072. doi: 10.1155/2013/892072. Epub 2013 Feb 27. ISRN Neurol. 2013. PMID: 23533806 Free PMC article.
-
Coevolution of brain structures in amnestic mild cognitive impairment.Neuroimage. 2013 Feb 1;66:449-56. doi: 10.1016/j.neuroimage.2012.10.029. Epub 2012 Oct 24. Neuroimage. 2013. PMID: 23103689 Free PMC article.
-
Automated identification of dementia using medical imaging: a survey from a pattern classification perspective.Brain Inform. 2016 Mar;3(1):17-27. doi: 10.1007/s40708-015-0027-x. Epub 2015 Dec 21. Brain Inform. 2016. PMID: 27747596 Free PMC article.
-
Effects of Ballroom Dance on Physical Fitness and Reaction Time in Experienced Middle-Aged Adults of Both Genders.Int J Environ Res Public Health. 2021 Feb 19;18(4):2036. doi: 10.3390/ijerph18042036. Int J Environ Res Public Health. 2021. PMID: 33669760 Free PMC article.
References
-
- Andreasen NC, Rajarethinam R, Cizadlo T, Arndt S, Swayze VWI, Flashman LA, O'Leary DS, Ehrhardt JC, Yuh WTC. Automatic atlas-based volume estimation of human brain regions from MR images. J Comput Assist Tomogr. 1996;20:98–106. - PubMed
-
- Braak H, Braak E. Frequency of stages of Alzheimer-related lesions in different age categories. Neurobiol Aging. 1997;18:351–357. - PubMed
-
- Chan D, Fox NC, Jenkins R, Scahill RI, Crum WR, Rossor MN. Rates of global and regional cerebral atrophy in AD and frontotemporal dementia. Neurology. 2001;57:1756–1763. - PubMed
-
- Coffey CE, Wilkinson WE, Parashos IA, Soady SAR, Sullivan RJ, Patterson LJ, Figiel GS, Webb MC, Spritzer CE, Djang WT. Quantitative cerebral anatomy of the aging human brain: a cross-sectional study using magnetic resonance imaging. Neurology. 1992;42:527–536. - PubMed
-
- Convit A, De Leon MJ, Tarshish C, De Santi S, Tsui W, Rusinek H, George A. Specific hippocampal volume reductions in individuals at risk for Alzheimer's disease. Neurobiol Aging. 1997;18:131–138. - PubMed
MeSH terms
LinkOut - more resources
Full Text Sources
Other Literature Sources
Medical