A quantitative analysis of intron effects on mammalian gene expression
- PMID: 12702819
- PMCID: PMC1370426
- DOI: 10.1261/rna.5250403
A quantitative analysis of intron effects on mammalian gene expression
Abstract
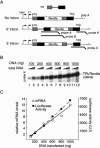
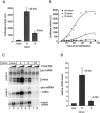
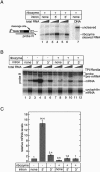
In higher eukaryotes, intron-containing and intronless versions of otherwise identical genes can exhibit dramatically different expression profiles. Introns and the act of their removal by the spliceosome can affect gene expression at many different levels, including transcription, polyadenylation, mRNA export, translational efficiency, and the rate of mRNA decay. However, the extent to which each of these steps contributes to the overall effect of any one intron on gene expression has not been rigorously tested. Here we report construction and initial characterization of a luciferase-based reporter system for monitoring the effects of individual introns and their position within the gene on protein expression in mammalian cells. Quantitative analysis of constructs containing human TPI intron 6 at two different positions within the Renilla luciferase open reading frame revealed that this intron acts primarily to enhance mRNA accumulation. Spliced mRNAs also exhibited higher translational yields than did intronless transcripts. However, nucleocytoplasmic mRNA distribution and mRNA stability were largely unaffected. These findings were extended to two other introns in a TCR-beta minigene.
Figures


Similar articles
-
Pre-mRNA processing enhancer (PPE) elements from intronless genes play additional roles in mRNA biogenesis than do ones from intron-containing genes.Nucleic Acids Res. 2005 Apr 20;33(7):2215-26. doi: 10.1093/nar/gki506. Print 2005. Nucleic Acids Res. 2005. PMID: 15843684 Free PMC article.
-
PABPN1 prevents the nuclear export of an unspliced RNA with a constitutive transport element and controls human gene expression via intron retention.RNA. 2023 May;29(5):644-662. doi: 10.1261/rna.079294.122. Epub 2023 Feb 8. RNA. 2023. PMID: 36754576 Free PMC article.
-
Introns and their positions affect the translational activity of mRNA in plant cells.EMBO Rep. 2001 May;2(5):394-8. doi: 10.1093/embo-reports/kve090. EMBO Rep. 2001. PMID: 11375930 Free PMC article.
-
How introns influence and enhance eukaryotic gene expression.Trends Biochem Sci. 2003 Apr;28(4):215-20. doi: 10.1016/S0968-0004(03)00052-5. Trends Biochem Sci. 2003. PMID: 12713906 Review.
-
Cancer-Associated Perturbations in Alternative Pre-messenger RNA Splicing.Cancer Treat Res. 2013;158:41-94. doi: 10.1007/978-3-642-31659-3_3. Cancer Treat Res. 2013. PMID: 24222354 Review.
Cited by
-
The PNUTS-PP1 complex acts as an intrinsic barrier to herpesvirus KSHV gene expression and replication.Nat Commun. 2022 Dec 2;13(1):7447. doi: 10.1038/s41467-022-35268-4. Nat Commun. 2022. PMID: 36460671 Free PMC article.
-
The position of the longest intron is related to biological functions in some human genes.Front Genet. 2023 Jan 10;13:1085139. doi: 10.3389/fgene.2022.1085139. eCollection 2022. Front Genet. 2023. PMID: 36712854 Free PMC article.
-
Molecular analysis of the first intron in the bovine myostatin gene.Mol Biol Rep. 2011 Oct;38(7):4643-9. doi: 10.1007/s11033-010-0598-9. Epub 2010 Dec 2. Mol Biol Rep. 2011. PMID: 21125331
-
Mir-434-5p mediates skin whitening and lightening.Clin Cosmet Investig Dermatol. 2008 Oct 7;1:19-35. doi: 10.2147/ccid.s4181. Clin Cosmet Investig Dermatol. 2008. PMID: 21437136 Free PMC article.
-
The exon junction complex as a node of post-transcriptional networks.Nat Rev Mol Cell Biol. 2016 Jan;17(1):41-54. doi: 10.1038/nrm.2015.7. Epub 2015 Dec 16. Nat Rev Mol Cell Biol. 2016. PMID: 26670016 Review.
References
-
- Andrulis, E.D., Werner, J., Nazarian, A., Erdjument-Bromage, H., Tempst, P., and Lis, J.T. 2002. The RNA processing exosome is linked to elongating RNA polymerase II in Drosophila. Nature 420: 837–841. - PubMed
-
- Bousquet-Antonelli, C., Presutti, C., and Tollervey, D. 2000. Identification of a regulated pathway for nuclear pre-mRNA turnover. Cell 102: 765–775. - PubMed
-
- Bouvet, P. and Wolffe, A.P. 1994. A role for transcription and FRGY2 in masking maternal mRNA within Xenopus oocytes. Cell 77: 931–941. - PubMed
Publication types
MeSH terms
Substances
Grants and funding
LinkOut - more resources
Full Text Sources
Other Literature Sources
Miscellaneous
