. 2003 Apr 14;161(1):41-54.
doi: 10.1083/jcb.200207030.

Mitochondrial targeting and a novel transmembrane arrest of Alzheimer's amyloid precursor protein impairs mitochondrial function in neuronal cells

Affiliations

Mitochondrial targeting and a novel transmembrane arrest of Alzheimer's amyloid precursor protein impairs mitochondrial function in neuronal cells

Hindupur K Anandatheerthavarada et al. J Cell Biol. .

Abstract

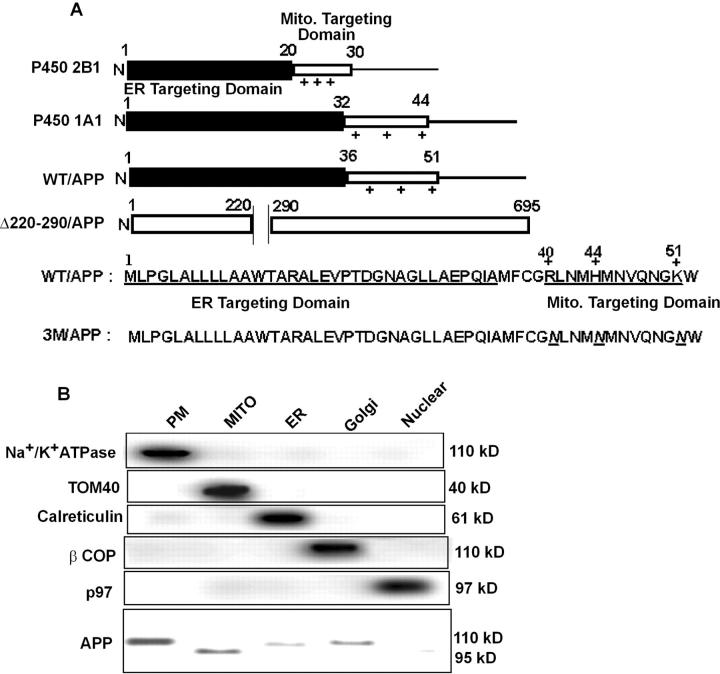
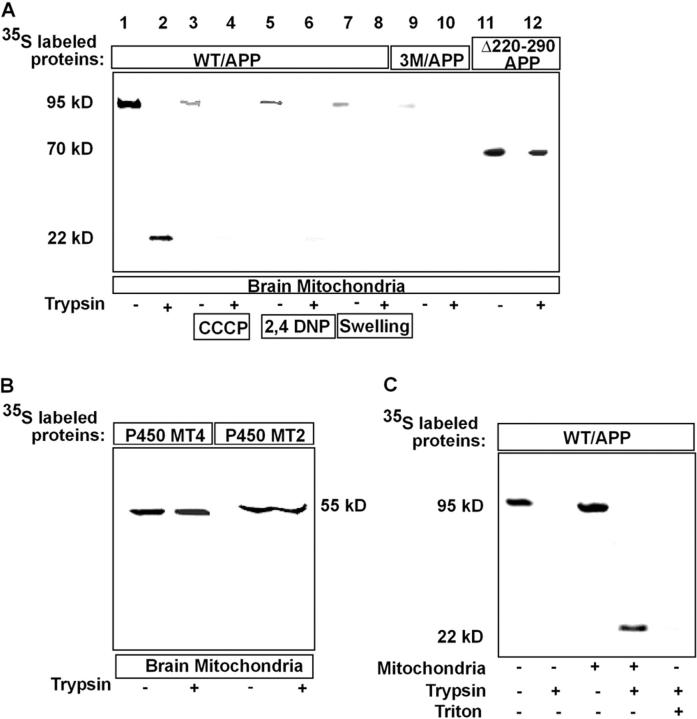
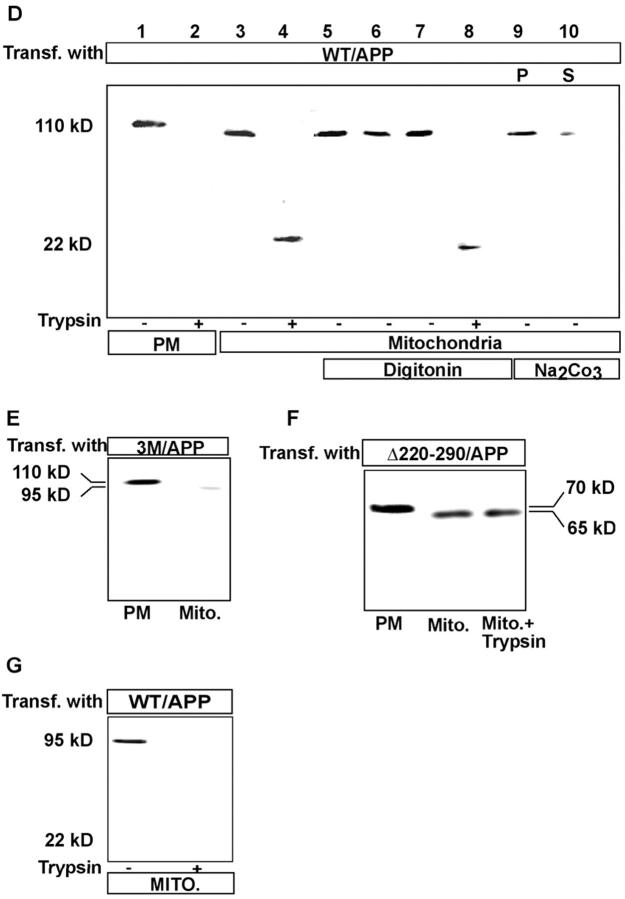
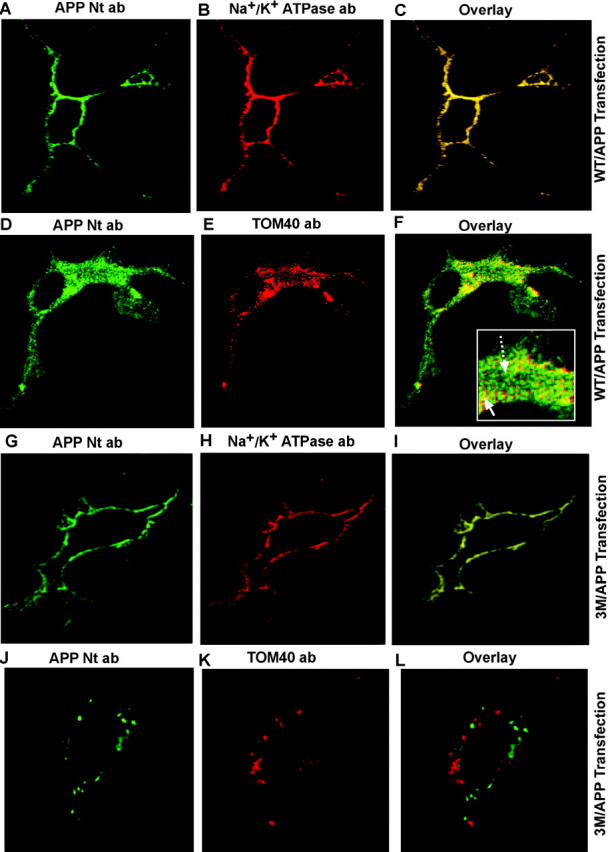
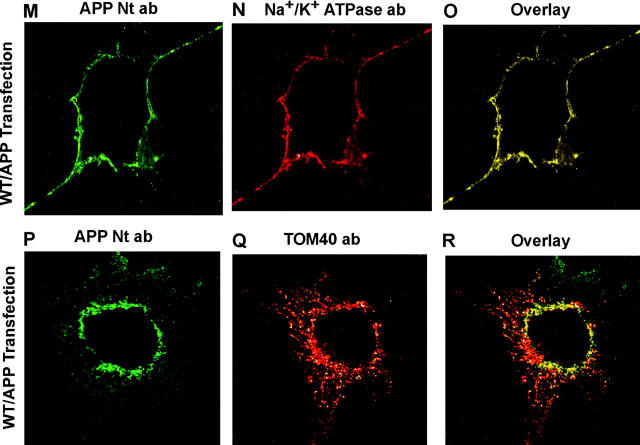
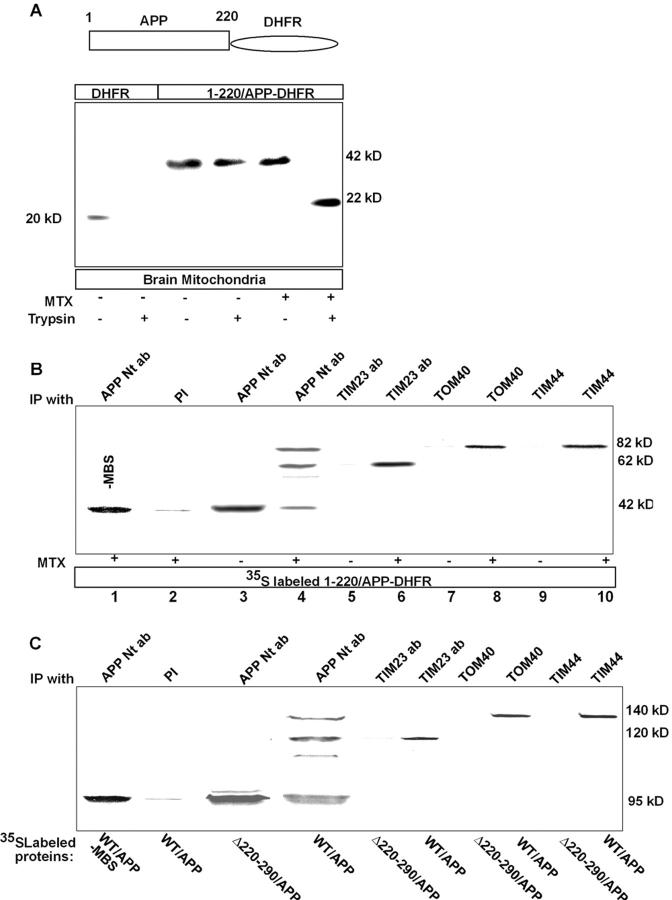
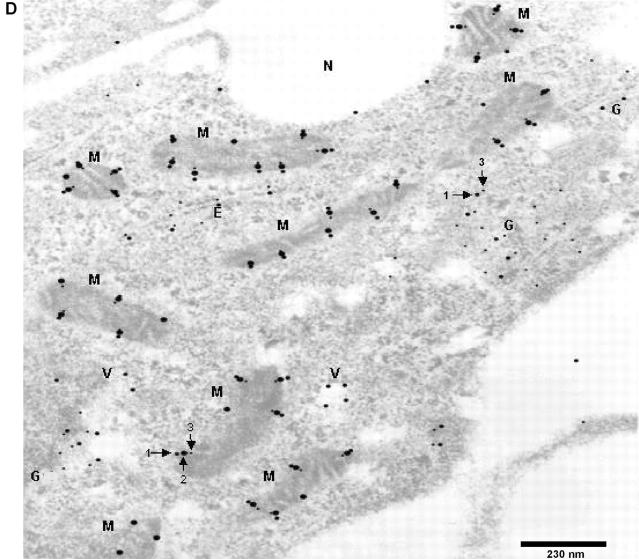
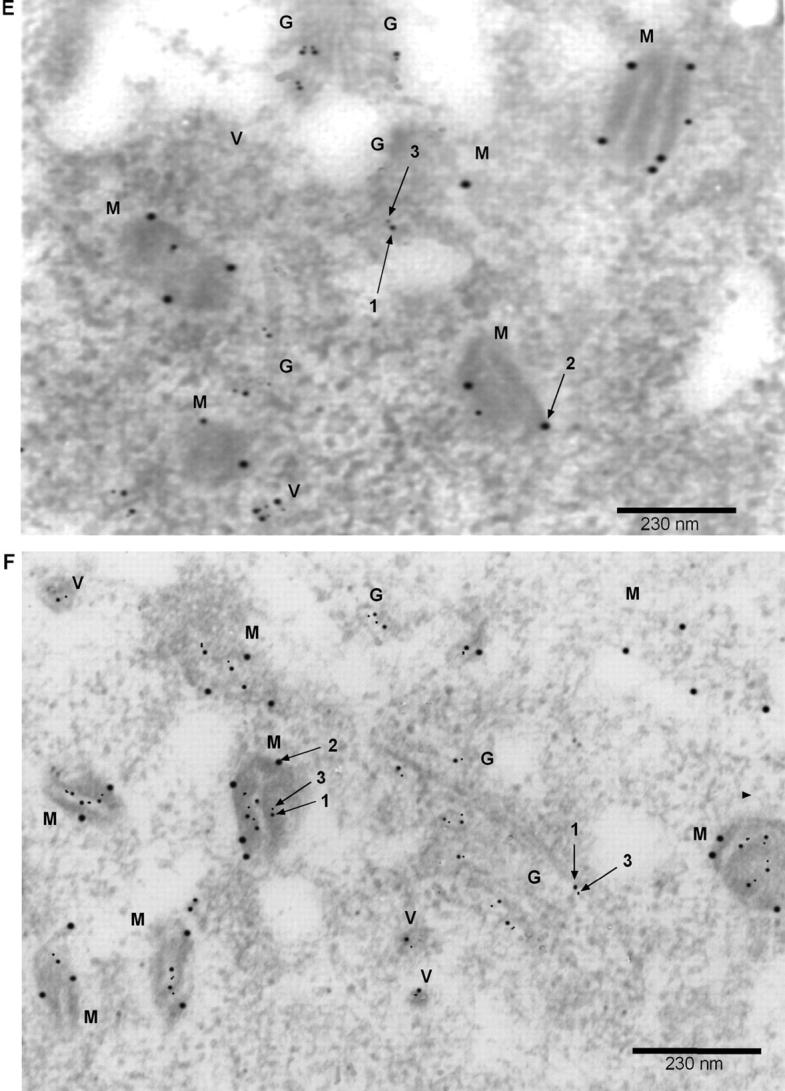
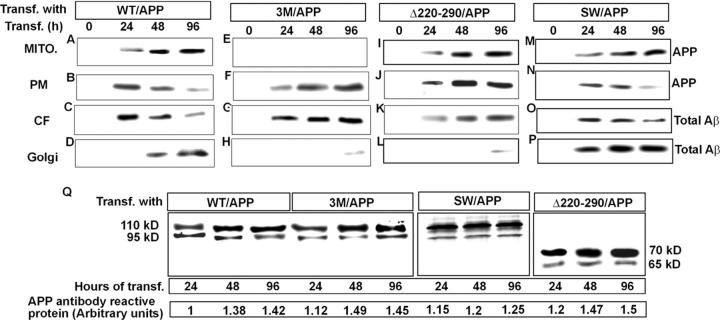
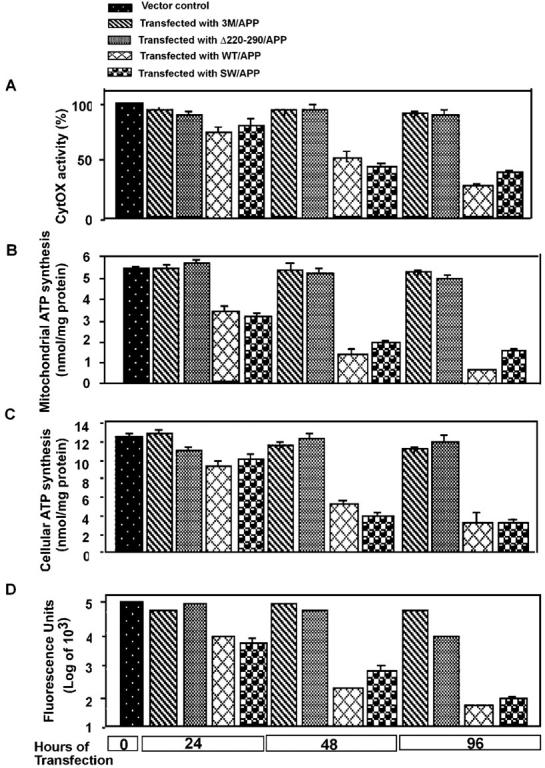
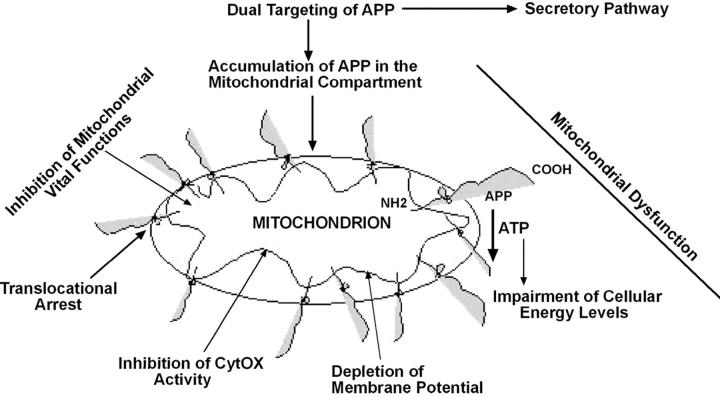
Alzheimer's amyloid precursor protein 695 (APP) is a plasma membrane protein, which is known to be the source of the toxic amyloid beta (Abeta) peptide associated with the pathogenesis of Alzheimer's disease (AD). Here we demonstrate that by virtue of its chimeric NH2-terminal signal, APP is also targeted to mitochondria of cortical neuronal cells and select regions of the brain of a transgenic mouse model for AD. The positively charged residues at 40, 44, and 51 of APP are critical components of the mitochondrial-targeting signal. Chemical cross-linking together with immunoelectron microscopy show that the mitochondrial APP exists in NH2-terminal inside transmembrane orientation and in contact with mitochondrial translocase proteins. Mutational studies show that the acidic domain, which spans sequence 220-290 of APP, causes the transmembrane arrest with the COOH-terminal 73-kD portion of the protein facing the cytoplasmic side. Accumulation of full-length APP in the mitochondrial compartment in a transmembrane-arrested form, but not lacking the acidic domain, caused mitochondrial dysfunction and impaired energy metabolism. These results show, for the first time, that APP is targeted to neuronal mitochondria under some physiological and pathological conditions.


Figures

Figure 1.
Figure 1.
Chimeric signal properties of APP and its bimodal targeting to mitochondria and PMs. (A) Chimeric signals of APP and comparison with the signal domains of P4501A1 and 2B1. The ER-targeting sequence (1–36) of APP is indicated as a dark shaded area. Sequence 36–61 with three positively charged residues (at positions 40, 44, and 51), the predicted mitochondrial-targeting sequence, and the mutant construct 3M/APP carrying mutations at these positions are shown. (B) Immunoblot analysis of marker proteins for different subcellular fractions (50 μg protein each) using antibodies to Na+/K+ ATPase, TOM40, calreticulin, βCOP, and p97. The bottom panel represents 200 μg protein from each membrane fraction and was developed with APP Nt Ab. (C) Northern blot analysis of total RNA (25 μg RNA each) from HCN cells treated with PMA for different time intervals. Hybridization with 18S DNA probe served as a loading control. (D) Western blot analysis of mitochondria and PM proteins (200 μg protein each) from HCN cells treated with PMA for different time intervals using APP Nt Ab. (E) Measurement of reduction of MTT dye by freshly isolated mitochondria from HCN-1A cells treated with PMA for various time points was performed as described in the Materials and methods. (F) Immunoblot analysis of glycosidase-treated proteins (200 μg each) from PMA (100 nM)-induced HCN cells using APP Nt Ab. Treatment with glycosidases was performed as described in the Materials and methods. Mito, mitochondria.
Figure 1.
Figure 1.
Chimeric signal properties of APP and its bimodal targeting to mitochondria and PMs. (A) Chimeric signals of APP and comparison with the signal domains of P4501A1 and 2B1. The ER-targeting sequence (1–36) of APP is indicated as a dark shaded area. Sequence 36–61 with three positively charged residues (at positions 40, 44, and 51), the predicted mitochondrial-targeting sequence, and the mutant construct 3M/APP carrying mutations at these positions are shown. (B) Immunoblot analysis of marker proteins for different subcellular fractions (50 μg protein each) using antibodies to Na+/K+ ATPase, TOM40, calreticulin, βCOP, and p97. The bottom panel represents 200 μg protein from each membrane fraction and was developed with APP Nt Ab. (C) Northern blot analysis of total RNA (25 μg RNA each) from HCN cells treated with PMA for different time intervals. Hybridization with 18S DNA probe served as a loading control. (D) Western blot analysis of mitochondria and PM proteins (200 μg protein each) from HCN cells treated with PMA for different time intervals using APP Nt Ab. (E) Measurement of reduction of MTT dye by freshly isolated mitochondria from HCN-1A cells treated with PMA for various time points was performed as described in the Materials and methods. (F) Immunoblot analysis of glycosidase-treated proteins (200 μg each) from PMA (100 nM)-induced HCN cells using APP Nt Ab. Treatment with glycosidases was performed as described in the Materials and methods. Mito, mitochondria.
Figure 2.
Figure 2.
Mitochondrial targeting of APP under in vitro and in vivo conditions. (A, B and C) WT/APP, 3M/APP, Δ220–290/APP, P450 MT2 (+33/1A1), and P450 MT4 (2B1) proteins were used for the in vitro transport in isolated rat brain mitochondria as described in the Materials and methods using 250 μg trypsin/ml of reaction (+). (A, lanes 4–6) Mitochondria were preincubated with or without added inhibitors (50 μM CCCP or 50 μM 2,4 DNP) at 25°C for 10 min before initiating the in vitro transport. (C) Mitochondria were treated with 0.1% Triton X-100 before treatment with trypsin. In each case, 200 μg of mitochondrial protein was used for electrophoresis, and the gels were subjected to fluorography. (D–G) In vivo targeting of WT/APP, 3M/APP, and Δ220–290/APP. HCN-1A cells were transfected with WT/APP (D and G), 3M/APP (E), and Δ220–290/APP (F) cDNA constructs, and PM and mitochondrial fractions were probed with APP Ct Ab (D–F) and APP Nt Ab (G). Trypsin treatment was performed as in A. Treatment with digitonin and extraction with 0.1 M Na2CO3 (D, lanes 9 and 10) were performed as described in the Materials and methods. P, pellet; S, supernatant.
Figure 2.
Figure 2.
Mitochondrial targeting of APP under in vitro and in vivo conditions. (A, B and C) WT/APP, 3M/APP, Δ220–290/APP, P450 MT2 (+33/1A1), and P450 MT4 (2B1) proteins were used for the in vitro transport in isolated rat brain mitochondria as described in the Materials and methods using 250 μg trypsin/ml of reaction (+). (A, lanes 4–6) Mitochondria were preincubated with or without added inhibitors (50 μM CCCP or 50 μM 2,4 DNP) at 25°C for 10 min before initiating the in vitro transport. (C) Mitochondria were treated with 0.1% Triton X-100 before treatment with trypsin. In each case, 200 μg of mitochondrial protein was used for electrophoresis, and the gels were subjected to fluorography. (D–G) In vivo targeting of WT/APP, 3M/APP, and Δ220–290/APP. HCN-1A cells were transfected with WT/APP (D and G), 3M/APP (E), and Δ220–290/APP (F) cDNA constructs, and PM and mitochondrial fractions were probed with APP Ct Ab (D–F) and APP Nt Ab (G). Trypsin treatment was performed as in A. Treatment with digitonin and extraction with 0.1 M Na2CO3 (D, lanes 9 and 10) were performed as described in the Materials and methods. P, pellet; S, supernatant.
Figure 3.
Figure 3.
Subcellular localization of WT/APP and 3M/APP by immunofluorescence microscopy. HCN-1A cells (A–L) and COS cells (M–R) were transfected with WT/APP (A–F) or 3M/APP (G–L). The inset in F is a twofold enlargement of a region showing APP Ab–stained granular structures both overlapping and nonoverlapping with mitochondrial stain, as indicated by arrows. Nonpermeabilized cells (A–C, G–I, and M–O) were double immunostained with APP Nt Ab and monoclonal antibody to Na+/ K+ ATPase. Permeabilized cells (D–F, J–L, and P–R) were double stained with APP Nt Ab and rabbit polyclonal antibodies to TOM40. Staining patterns (A, B, D, E, G, H, J, K, M, N, P, and Q) were developed with appropriate secondary antibodies conjugated to Alexa dyes. (C, F, I, L, O, and R) Respective overlay patterns.
Figure 3.
Figure 3.
Subcellular localization of WT/APP and 3M/APP by immunofluorescence microscopy. HCN-1A cells (A–L) and COS cells (M–R) were transfected with WT/APP (A–F) or 3M/APP (G–L). The inset in F is a twofold enlargement of a region showing APP Ab–stained granular structures both overlapping and nonoverlapping with mitochondrial stain, as indicated by arrows. Nonpermeabilized cells (A–C, G–I, and M–O) were double immunostained with APP Nt Ab and monoclonal antibody to Na+/ K+ ATPase. Permeabilized cells (D–F, J–L, and P–R) were double stained with APP Nt Ab and rabbit polyclonal antibodies to TOM40. Staining patterns (A, B, D, E, G, H, J, K, M, N, P, and Q) were developed with appropriate secondary antibodies conjugated to Alexa dyes. (C, F, I, L, O, and R) Respective overlay patterns.
Figure 4.
Figure 4.
Transmembrane-arrested APP exists in contact with mitochondrial translocase proteins. 35S-labeled APP (1–220) fused to DHFR (APP–DHFR), WT/APP, or Δ220–290/APP proteins were used for in vitro transport with isolated yeast mitochondria, and translocation intermediates were cross-linked with MBS as described below. In indicated experiments, MTX (1 μmol/ml of reaction) was added to generate translocation intermediates. Both the input and cross-linked products were immunoprecipitated with antibody to APP and then probed with indicated antibodies by immunoblot analysis. (A) In vitro transport of APP–DHFR fusion protein. Trypsin treatment (250 μg /ml reaction) was performed for 20 min on ice as described in the Materials and methods. (B) Cross-linking of APP–DHFR fusion protein with yeast mitochondrial translocases. (C) Cross-linking of WT/APP and Δ220–290/APP with yeast mitochondrial translocase proteins. In vitro transport was performed with indicated proteins in the absence of added MTX. (D, E, and F) Immunoelectron microscopy of HCN-1A cells transfected with WT/APP, 3MAPP, and Δ22–290/APP, respectively, for 32 h. M, mitochondrion; G, Golgi; E, ER; N, nucleus; V, vesicles. Arrow 1, COOH terminus of APP (10-nm gold particle); arrow 2, TOM40 (20-nm gold particle); arrow 3, NH2 terminus of APP (5-nm gold particle).
Figure 4.
Figure 4.
Transmembrane-arrested APP exists in contact with mitochondrial translocase proteins. 35S-labeled APP (1–220) fused to DHFR (APP–DHFR), WT/APP, or Δ220–290/APP proteins were used for in vitro transport with isolated yeast mitochondria, and translocation intermediates were cross-linked with MBS as described below. In indicated experiments, MTX (1 μmol/ml of reaction) was added to generate translocation intermediates. Both the input and cross-linked products were immunoprecipitated with antibody to APP and then probed with indicated antibodies by immunoblot analysis. (A) In vitro transport of APP–DHFR fusion protein. Trypsin treatment (250 μg /ml reaction) was performed for 20 min on ice as described in the Materials and methods. (B) Cross-linking of APP–DHFR fusion protein with yeast mitochondrial translocases. (C) Cross-linking of WT/APP and Δ220–290/APP with yeast mitochondrial translocase proteins. In vitro transport was performed with indicated proteins in the absence of added MTX. (D, E, and F) Immunoelectron microscopy of HCN-1A cells transfected with WT/APP, 3MAPP, and Δ22–290/APP, respectively, for 32 h. M, mitochondrion; G, Golgi; E, ER; N, nucleus; V, vesicles. Arrow 1, COOH terminus of APP (10-nm gold particle); arrow 2, TOM40 (20-nm gold particle); arrow 3, NH2 terminus of APP (5-nm gold particle).
Figure 5.
Figure 5.
Subcellular distribution of ectopically expressed APPs in HCN-1A cells. Cells were transfected with WT/APP (A–D), 3M/APP (E–H), Δ220–290/APP (I–L), and SW/APP (M–P). At indicated times after transfection, mitochondria (MITO.), PM, and Golgi fractions (50 μg protein each) and also protein concentrate from 10 ml of cell-free culture medium (CM) were subjected to Western immunoblot analysis using antibodies to APP Nt (A, B, E, F, I, J, M, and N) or Aβ (C, D, G, H, K, L, O, and P). (Q) The level of expression of total APP protein in cells transfected with various cDNA constructs for different time points was monitored by immunoblot analysis of whole cell lysates. The antibody-reactive proteins were quantified using a Bio-Rad Laboratories Fluoro S imaging system. Table I shows the distribution of APP in different membrane fractions at different time points after transfection with WT/APP and SW/APP cDNAs. Values at the bottom of Q show relative APP levels in comparison with the level at 24-h transfection that was considered to be 1. (R) Pulse chase characteristics of mitochondrial- and PM-associated APP. HCN-1A cells transfected with WT/APP cDNA for 24 h were labeled with [35S]Met for 2 h, followed by a chase in normal growth medium containing 3 mM unlabeled Met. Mitochondrial and PM proteins from cells at different points of chase (500 μg each) were immunoprecipitated with APP Nt Ab, analyzed by electrophoresis on 10% SDS-polyacrylamide gels, and imaged through a Bio-Rad Laboratories GS525 molecular imager. The immunoblot at the top of the figure was performed using 100 μg protein from each fraction using APP Nt Ab.
Figure 5.
Figure 5.
Subcellular distribution of ectopically expressed APPs in HCN-1A cells. Cells were transfected with WT/APP (A–D), 3M/APP (E–H), Δ220–290/APP (I–L), and SW/APP (M–P). At indicated times after transfection, mitochondria (MITO.), PM, and Golgi fractions (50 μg protein each) and also protein concentrate from 10 ml of cell-free culture medium (CM) were subjected to Western immunoblot analysis using antibodies to APP Nt (A, B, E, F, I, J, M, and N) or Aβ (C, D, G, H, K, L, O, and P). (Q) The level of expression of total APP protein in cells transfected with various cDNA constructs for different time points was monitored by immunoblot analysis of whole cell lysates. The antibody-reactive proteins were quantified using a Bio-Rad Laboratories Fluoro S imaging system. Table I shows the distribution of APP in different membrane fractions at different time points after transfection with WT/APP and SW/APP cDNAs. Values at the bottom of Q show relative APP levels in comparison with the level at 24-h transfection that was considered to be 1. (R) Pulse chase characteristics of mitochondrial- and PM-associated APP. HCN-1A cells transfected with WT/APP cDNA for 24 h were labeled with [35S]Met for 2 h, followed by a chase in normal growth medium containing 3 mM unlabeled Met. Mitochondrial and PM proteins from cells at different points of chase (500 μg each) were immunoprecipitated with APP Nt Ab, analyzed by electrophoresis on 10% SDS-polyacrylamide gels, and imaged through a Bio-Rad Laboratories GS525 molecular imager. The immunoblot at the top of the figure was performed using 100 μg protein from each fraction using APP Nt Ab.
Figure 6.
Figure 6.
Effects of transmembrane-arrested APP on mitochondrial functions. Total cell extracts or mitochondria from HCN-1A cells transfected with WT/APP, 3M/APP, Δ220–290/APP, and SW/APP were analyzed for CytOX activity (A), mitochondria and total cell ATP generation (B and C, respectively), and changes in the mitochondrial membrane potential using MitoTracker orange CM-H2TM ROS (D), as described in the Materials and methods. Mitochondrial CytOX activity (2 nmol of cytochrome c oxidized/min/mg mitochondrial protein) from vector alone–transfected cells was used as 100% activity. Values represent mean ± SEM from three separate transfection experiments.
Figure 7.
Figure 7.
Mitochondrial-associated APP in the brains of transgenic mice overexpressing APP. (A) Mitochondria and PM fractions from different brain regions of control and SWEAPP (2576) transgenic mice (50 μg protein each) were subjected to immunoblot analysis using APP Nt Ab. (B) Mitochondria (50 μg) from different brain regions of transgenic mice overexpressing SW/APP (SWEAPP [2576]) were subjected to trypsin treatment (as described in Fig. 2) followed by immunoblot analysis with APP Nt Ab. (C) CytOX activity in total mitochondrial membrane fraction and (D) total cellular ATP levels were assayed as described in the Materials and methods. MITO., mitochondria; Ctl, control; Tg, transgenic; Ct, cortex; Hp, hippocampus; Ce, cerebellum.
Figure 8.
Figure 8.
A proposed model for the mitochondrial targeting and accumulation of transmembrane- arrested APP affecting mitochondrial functions.

Similar articles

Cited by

References

    1. Addya, S., H.K. Anandatheerthavarada, G. Biswas, S.V. Bhagwat, J. Mullick, and N.G. Avadhani. 1997. Targeting of NH2-terminal–processed microsomal protein to mitochondria: a novel pathway for the biogenesis of hepatic mitochondrial P450MT2. J. Cell Biol. 139:589–599. - PMC - PubMed
    1. Amuthan, G., G. Biswas, H.K. Anandatheerthavarada, C. Vijayasarathy, H.M. Shephard, and N.G. Avadhani. 2002. Mitochondrial stress-induced calcium signaling, phenotypic changes and invasive behavior in human lung carcinoma A549 cells. Oncogene. 21:7839–7849. - PubMed
    1. Anandatheerthavarada, H.K., G. Biswas, J. Mullick, N.B. Sepuri, L. Otvos, D. Pain, and N.G. Avadhani. 1999. Dual targeting of cytochrome P4502B1 to endoplasmic reticulum and mitochondria involves a novel signal activation by cyclic AMP-dependent phosphorylation at ser128. EMBO J. 18:5494–5504. - PMC - PubMed
    1. Beal, M.F. 1998. Mitochondrial dysfunction in neurodegenerative diseases. Biochim. Biophys. Acta. 1366:211–223. - PubMed
    1. Busciglio, J., A. Pelsman, C. Wong, G. Pigino, M. Yuan, H. Mori, and B.A. Yankner. 2002. Altered metabolism of the amyloid β precursor protein is associated with mitochondrial dysfunction in Down's syndrome. Neuron. 33:677–688. - PubMed

Publication types

MeSH terms

Substances