. 2003 Apr;23(7):2225-38.
doi: 10.1128/MCB.23.7.2225-2238.2003.

Negative regulation of BRCA1 gene expression by HMGA1 proteins accounts for the reduced BRCA1 protein levels in sporadic breast carcinoma

Affiliations

Negative regulation of BRCA1 gene expression by HMGA1 proteins accounts for the reduced BRCA1 protein levels in sporadic breast carcinoma

Gustavo Baldassarre et al. Mol Cell Biol. 2003 Apr.

Abstract

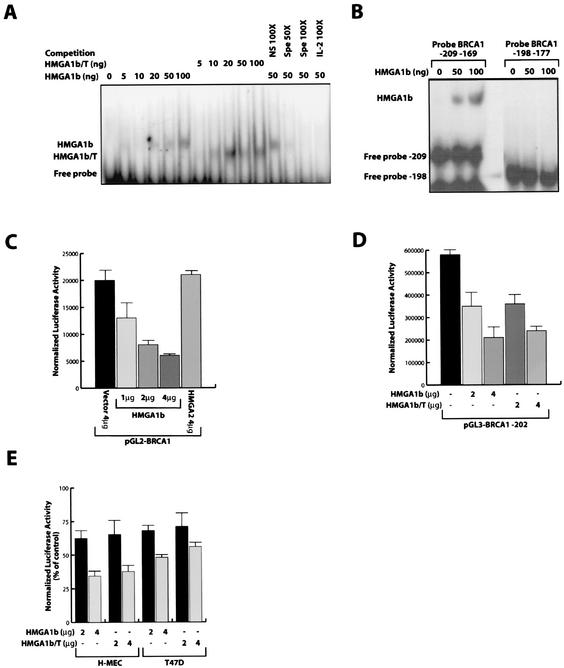
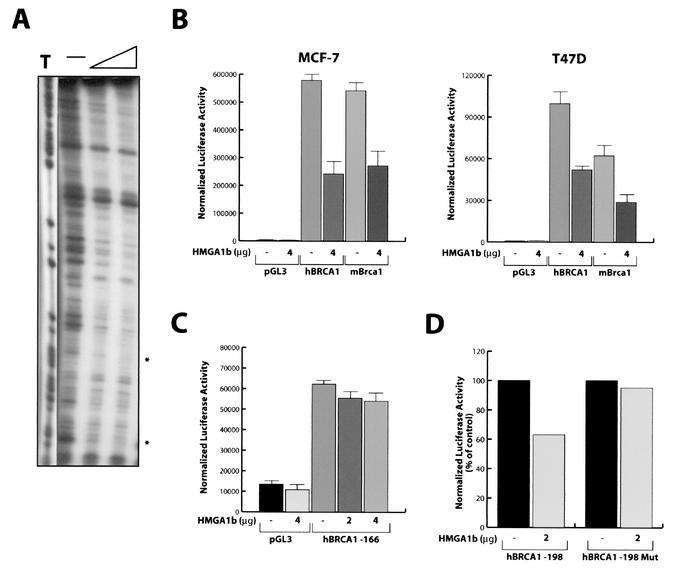
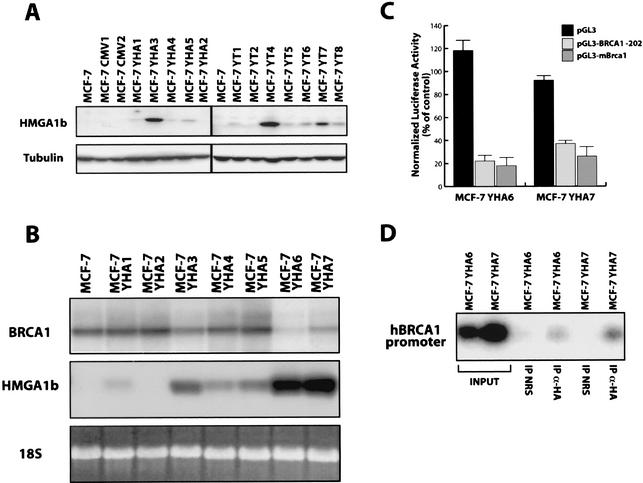
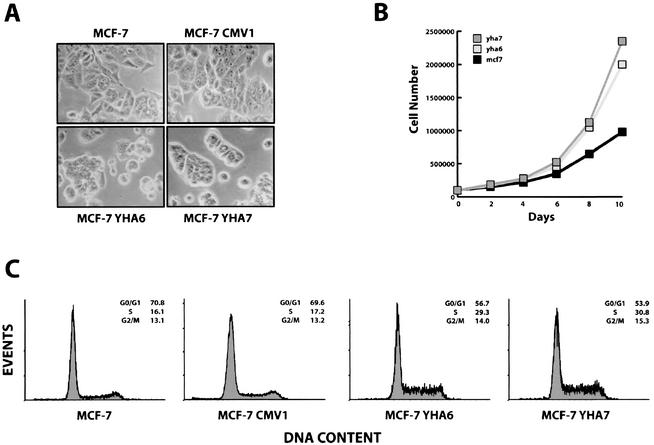
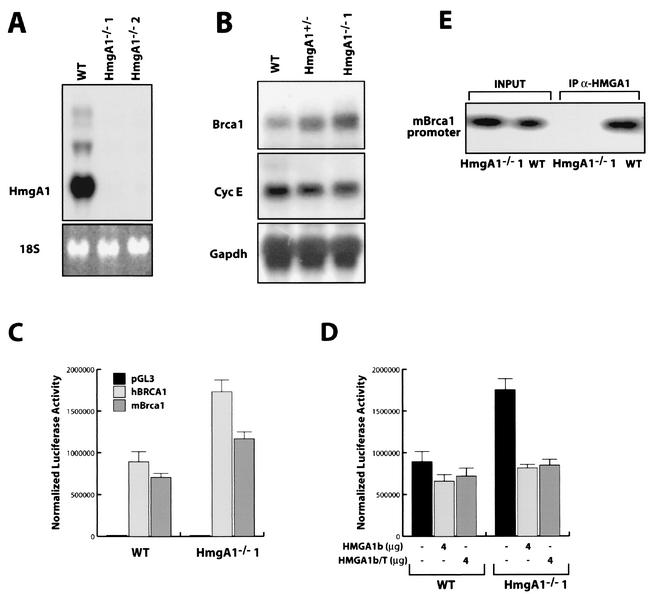
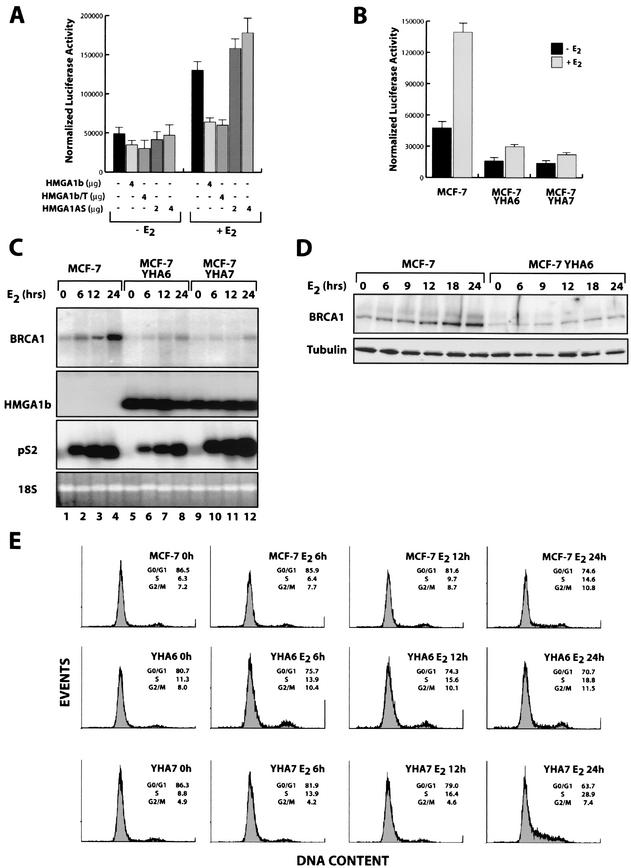
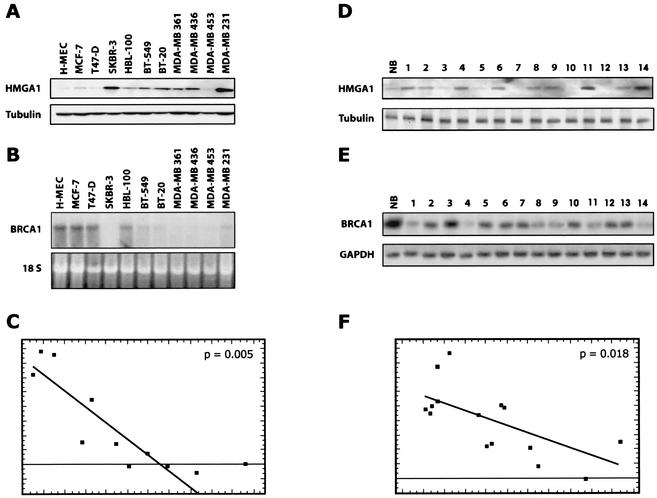
A drastic reduction in BRCA1 gene expression is a characteristic feature of aggressive sporadic breast carcinoma. However, the mechanisms underlying BRCA1 downregulation in breast cancer are not well understood. Here we report that both in vitro and in vivo HMGA1b protein binds to and inhibits the activity of both human and mouse BRCA1 promoters. Consistently, murine embryonic stem (ES) cells with the Hmga1 gene deleted display higher Brca1 mRNA and protein levels than do wild-type ES cells. Stable transfection of MCF-7 cells with the HMGA1b cDNA results in a decrease of BRCA1 gene expression and in a lack of BRCA1 induction after estrogen treatment. Finally, we found an inverse correlation between HMGA1 and BRCA1 mRNA and protein expression in human mammary carcinoma cell lines and tissues. These data indicate that HMGA1 proteins are involved in transcriptional regulation of the BRCA1 gene, and their overexpression may have a role in BRCA1 downregulation observed in aggressive mammary carcinomas.


Figures

FIG. 1.
FIG. 1.
HMGA1 protein binds to and downregulates the human BRCA1 promoter. (A) EMSA performed with a radiolabeled oligonucleotide spanning from nt −209 to −169 of the human BRCA1 promoter incubated with increasing amounts of recombinant HMGA1b or HMGA1b/T proteins as indicated. To assess the specificity of the binding, 50 ng of recombinant protein was incubated in the presence of a 100-fold excess of unlabeled nonspecific oligonucleotide (lane 12), in the presence of a 50- to 100-fold excess of the nt −209 to −169 unlabeled oligonucleotide as specific competitor (lane 13 and 14), or a 100-fold excess of the IL-2 CD28RE unlabeled oligonucleotide (lane 15). (B) EMSA performed with a radiolabeled oligonucleotide spanning from nt −209 to −169 and from nt −198 to −177 of the human BRCA1 promoter incubated with increasing amounts of recombinant HMGA1b protein as indicated. (C) Effect of increasing amounts (as indicated) of the HMGA1b expression vector on the human BRCA1 promoter region (pGL2-BRCA1) transfected in the MCF-7 cells. (Error bar, standard deviation.) (D) Effect of HMGA1b and HMGA1b/T constructs on the activity of the BRCA1 minimal promoter region (pGL3-BRCA1-202) transfected in the MCF-7 cells. (Error bar, standard deviation). (E) Effect of HMGA1b and HMGA1b/T constructs on the activity of the pGL3-BRCA1-202 reporter vector transfected in the H-MEC and in the T47D cell lines.
FIG. 2.
FIG. 2.
HMGA1 protein interferes with the activity of mouse Brca1 promoter. (A) DNase I footprinting assay of human BRCA1 promoter fragment nt −209 to +45. The asterisks indicate the regions of binding between the human BRCA1 promoter and the HMGA1b recombinant protein flanking the positive regulatory region. (B) Effect of HMGA1b and HMGA1b/T overexpression on the activity of human and mouse BRCA1 minimal promoter regions transfected in the MCF-7 and in the T47D cell lines. (C) Effect of HMGA1b overexpression on the activity of human BRCA1 promoter mutant −166, which lacks the putative HMGA1 binding sites, transfected in the MCF-7 cells. (D) Effect of HMGA1b overexpression on the activity of human BRCA1-198 and BRCA1-198Mut, in which T −177 and −178 were replaced with G in MCF-7 cells. (B to D) Error bar, standard deviation.
FIG. 3.
FIG. 3.
Impaired expression of BRCA1 in MCF-7 Y-HA cells. (A) Expression of HMGA1b and HMGA1b/T proteins in MCF-7 cells stable transfected with the full-length (YHA) or the truncated HMGA1b (YT) expression vectors. (B) Northern blot analysis of BRCA1 (upper panel) and HMGA1 (middle panel) expression in MCF-7 cells and in seven MCF-7 YHA clones expressing different levels of HMGA1b mRNA. Levels of 18S rRNA were used to monitor RNA amounts in each lane (lower panel). (C) Activity of the human and mouse BRCA1 minimal promoter regions transfected in MCF-7 YHA6 and YHA7 cell lines. The pGL3 vector was transfected as a control. The activity is expressed as a percentage of the activity exhibited in the MCF-7 cells. (D) The ChIP assay was performed on MCF-7 YHA6 and YHA7 cells. The purified DNA was used as a template for PCRs with primers that amplify the human BRCA1 promoter region comprised between base −202 and +36.
FIG. 4.
FIG. 4.
Increased growth ability in MCF-7 overexpressing the HMGA1b protein. (A) Light microscopy photograph of parental MCF-7 cells (MCF-7) and cells transfected with the backbone vector (MCF-7 CMV1), or with the HMGA1b-HA tagged construct (YHA6 and YHA7). (B) Monolayer growth curves compare the growth abilities of MCF-7, MCF-7 YHA6, and MCF-7 YHA7 cell lines. (C) Flow cytometry analysis of MCF-7 cells and its derivative clones CMV-1, YHA6, and YHA7. A representative experiment is reported.
FIG. 5.
FIG. 5.
Hmga−/− cells express higher levels of BRCA1 mRNA and protein. (A) Hmga1 expression in wild-type (WT) ES cells and in two different Hmga1−/− ES cell clones analyzed by Northern blotting. (B) Northern blot showing the expression of Brca1 (top panel), cyclin E (middle panel), and GAPDH (lower panel) mRNA in WT Hmga1+/− and Hmga1−/−1 ES cell lines. (C) Activity of the human and mouse BRCA1 minimal promoter regions transfected in WT or Hmga1−/−1 ES cells. pGL3 vector was transfected as a control. Error bar, standard deviation. (D) Effect of HMGA1b overexpression on the activity of the human BRCA1 minimal promoter region transfected in WT or Hmga1−/−1 ES cells (Error bar, standard deviation.) Each transfection assay was performed in triplicate and repeated in at least three independent experiments and using two different Hmga1−/− ES cell clones. (E) ChIP assay performed on WT and Hmga1−/− (Hmga1−/−1) ES cells. The purified DNA untreated (input) or immunoprecipitated with an anti-HMGA1 antibody (IP α-HMGA1) was used as a template for the PCRs with primers that amplify the mouse Brca1 promoter region comprised between nt −236 and +44.
FIG.6.
FIG.6.
HMGA1b protein interferes with estrogen-induced upregulation of BRCA1. (A) Effect of HMGA1b, HMGA1b/T, and HMGA1bAS constructs on the activity of the pGL3-BRCA1-202 reporter vector transfected in the MCF-7 cells grown for three days in medium deprived of steroid hormones and stimulated (+E2) or not (−E2) with 10 nM of 17-β-estradiol. (B) Activity of the pGL3-BRCA1-202 vector transfected in the MCF-7, MCF-7 YHA6, and MCF-7 YHA7 cells grown for 3 days in medium deprived of steroid hormones and stimulated (+E2) or not (−E2) with 10 nM of 17-β-estradiol. (C) Northern blot analysis of BRCA1 (upper panel), HMGA1 (second panel), and pS2 (third panel) expression in MCF-7, MCF-7 YHA6, and MCF-7 YHA7 cells grown for 3 days in medium deprived of steroid hormones (lane 0) and stimulated with 10 nM of 17-β-estradiol (E2) for the indicated time. Levels of rRNA were used to monitor RNA amounts in each lane (lower panel). (D) Western blot analysis of BRCA1 (upper panel) expression in MCF-7 and MCF-7 YHA6 cells treated as described for panel C. α-Tubulin expression confirmed the equal amount of loaded proteins (lower panel). (E) Flow cytometry analysis of MCF-7 cells (first row) and its derivative clones, YHA6 (second row) and YHA7 (third row), treated as described in panel C.
FIG. 7.
FIG. 7.
Expression of HMGA1 and BRCA1 in primary breast tumors and in tumor-derived cell lines. (A) Expression of HMGA1 proteins in primary cultured epithelial cells (HMEC) and in 10 different mammary carcinoma-derived cell lines. As shown in the lower panel, α-tubulin expression was used to normalize the amount of the loaded proteins. (B) In the upper panel is the Northern blot of the BRCA1 expression in the indicated cell lines. In the lower panel, levels of 18S rRNA were used to monitor RNA amounts in each lane. (D) Western blot analysis of HMGA1 expression in a normal breast tissue (lane NB) and 14 different mammary carcinomas (lanes 1 to 9). α-Tubulin (lower panel) was used to normalize the blot. (E) RT-PCR analysis of BRCA1 expression in a normal breast tissue (lane NB) and 14 different mammary carcinomas. GAPDH expression (lower) was used as internal control of RNA quantity and status. (C and F) Statistical analysis of the HMGA1 protein and BRCA1 mRNA levels in the cell lines (C) and in the primary mammary tumors (F) by linear regression analysis. The expression of HMGA1 protein was determined by Western blot, quantified by densitometric analysis, and normalized for uniform gel loading with the signals obtained with antitubulin antibody. The levels of BRCA1 mRNA were determined by Northern blot (cell lines) or RT-PCR (primary tumors), quantified by densitometric analysis, and normalized. The linear regression plots between HMGA1 proteins ad BRCA1 mRNA levels were calculated by using the GB-STAT program.

Similar articles

Cited by

References

    1. Abe, N., T. Watanabe, M. Sugiyama, H. Uchimura, G. Chiappetta, A. Fusco, and Y. Atomi. 1999. Determination of high mobility group I(Y) expression level in colorectal neoplasias: a potential diagnostic marker. Cancer Res. 59:1169-1174. - PubMed
    1. Abe, N., T. Watanabe, T. Masaki, T. Mori, M. Sugiyama, H. Uchimura, Y. Fujioka, G. Chiappetta, A. Fusco, and Y. Atomi. 2000. Pancreatic duct cell carcinomas express high levels of high mobility group I(Y) proteins. Cancer Res. 60:3117-3122. - PubMed
    1. Baldassarre, G., M. V. Barone, B. Belletti, C. Sandomenico, P. Bruni, S. Spiezia, A. Boccia, M. T. Vento, A. Romano, S. Pepe, A. Fusco, and G. Viglietto. 1999. Key role of the cyclin-dependent kinase inhibitor p27kip1 for embryonal carcinoma cell survival and differentiation. Oncogene 18:6241-6251. - PubMed
    1. Baldassarre, G., M. Fedele, S. Battista, A. Vecchione, A. J. Klein-Szanto, M. Santoro, T. A. Waldmann, N. Azimi, C. M. Croce, and A. Fusco. 2001. Onset of natural killer cell lymphomas in transgenic mice carrying a truncated HMGI-C gene by the chronic stimulation of the IL-2 and IL-15 pathway. Proc. Natl. Acad. Sci. USA 98:7970-7975. - PMC - PubMed
    1. Bandiera, A., D. Bonifacio, G. Manfioletti, F. Mantovani, A. Rustighi, F. Zanconati, A. Fusco, L. Di Bonito, and V. Giancotti. 1998. Expression of HMGI(Y) proteins in squamous intraepithelial and invasive lesions of the uterine cervix. Cancer Res. 58:426-431. - PubMed

Publication types

MeSH terms