Heterogeneous presynaptic release probabilities: functional relevance for short-term plasticity
- PMID: 12609861
- PMCID: PMC1302728
- DOI: 10.1016/S0006-3495(03)74967-4
Heterogeneous presynaptic release probabilities: functional relevance for short-term plasticity
Abstract
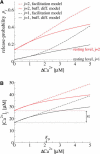
We discuss a model of presynaptic vesicle dynamics, which allows for heterogeneity in release probability among vesicles. Specifically, we explore the possibility that synaptic activity is carried by two types of vesicles; first, a readily releasable pool and, second, a reluctantly releasable pool. The pools differ regarding their probability of release and time scales on which released vesicles are replaced by new ones. Vesicles of both pools increase their release probability during repetitive stimulation according to the buildup of Ca(2+) concentration in the terminal. These properties are modeled to fit data from the calyx of Held, a giant synapse in the auditory pathway. We demonstrate that this arrangement of two pools of releasable vesicles can account for a variety of experimentally observed patterns of synaptic depression and facilitation at this synapse. We conclude that synaptic transmission cannot be accurately described unless heterogeneity of synaptic release probability is taken into account.
Figures


Similar articles
-
Vesicle pools and short-term synaptic depression: lessons from a large synapse.Trends Neurosci. 2002 Apr;25(4):206-12. doi: 10.1016/s0166-2236(02)02139-2. Trends Neurosci. 2002. PMID: 11998689 Review.
-
A simple depletion model of the readily releasable pool of synaptic vesicles cannot account for paired-pulse depression.J Neurophysiol. 2007 Jan;97(1):948-50. doi: 10.1152/jn.00554.2006. Epub 2006 Nov 1. J Neurophysiol. 2007. PMID: 17079345
-
Quantitative analysis of vesicle recycling at the calyx of Held synapse.Proc Natl Acad Sci U S A. 2015 Apr 14;112(15):4779-84. doi: 10.1073/pnas.1424597112. Epub 2015 Mar 30. Proc Natl Acad Sci U S A. 2015. PMID: 25825725 Free PMC article.
-
Mechanisms of target-cell specific short-term plasticity at Schaffer collateral synapses onto interneurones versus pyramidal cells in juvenile rats.J Physiol. 2005 Nov 1;568(Pt 3):815-40. doi: 10.1113/jphysiol.2005.093948. Epub 2005 Aug 18. J Physiol. 2005. PMID: 16109728 Free PMC article.
-
Estimation of quantal parameters at the calyx of Held synapse.Neurosci Res. 2002 Dec;44(4):343-56. doi: 10.1016/s0168-0102(02)00174-8. Neurosci Res. 2002. PMID: 12445623 Review.
Cited by
-
Rapid active zone remodeling during synaptic plasticity.J Neurosci. 2011 Apr 20;31(16):6041-52. doi: 10.1523/JNEUROSCI.6698-10.2011. J Neurosci. 2011. PMID: 21508229 Free PMC article.
-
A dual-Ca2+-sensor model for neurotransmitter release in a central synapse.Nature. 2007 Nov 29;450(7170):676-82. doi: 10.1038/nature06308. Nature. 2007. PMID: 18046404 Free PMC article.
-
Heterogeneous release probabilities and activity-dependent short-term synaptic depression.Commun Integr Biol. 2011 Sep;4(5):603-5. doi: 10.4161/cib.4.5.16752. Epub 2011 Sep 1. Commun Integr Biol. 2011. PMID: 22046475 Free PMC article.
-
Heterogeneous Ca2+ influx along the adult calyx of Held: a structural and computational study.Neuroscience. 2008 Jun 12;154(1):171-85. doi: 10.1016/j.neuroscience.2008.04.002. Epub 2008 Apr 7. Neuroscience. 2008. PMID: 18485608 Free PMC article.
-
Biophysical properties of presynaptic short-term plasticity in hippocampal neurons: insights from electrophysiology, imaging and mechanistic models.Front Cell Neurosci. 2014 May 22;8:141. doi: 10.3389/fncel.2014.00141. eCollection 2014. Front Cell Neurosci. 2014. PMID: 24904286 Free PMC article. Review.
References
-
- Abbott, L. F., J. A. Varela, K. Sen, and S. B. Nelson. 1997. Synaptic depression and cortical gain control. Science. 275:220–224. - PubMed
-
- Aharon, S., H. Parnas, and I. Parnas. 1994. The magnitude and significance of Ca2+ domains for release of neurotransmitter. Bull. Math. Biol. 56:1095–1119. - PubMed
-
- Bennett, M. R., N. Calckos, and R. H. Scheller. 1992. Syntaxin: a synaptic protein implicated in docking of synaptic vesicles at presynaptic active zones. Science. 257:255–259. - PubMed
-
- Bertram, R., A. Sherman, and E. F. Stanley. 1996. Single-domain/bound calcium hypothesis of transmitter release and facilitation. J. Neurophysiol. 75:1919–1931. - PubMed
Publication types
MeSH terms
Substances
LinkOut - more resources
Full Text Sources
Miscellaneous

