. 2003 Feb 15;31(4):1234-44.
doi: 10.1093/nar/gkg210.

Evolution of transcription factors and the gene regulatory network in Escherichia coli

Affiliations

Evolution of transcription factors and the gene regulatory network in Escherichia coli

M Madan Babu et al. Nucleic Acids Res. .

Abstract

The most detailed information presently available for an organism's transcriptional regulation network is that for the prokaryote Escherichia coli. In order to gain insight into the evolution of the E.coli regulatory network, we analysed information obtainable for the domains and protein families of the transcription factors and regulated genes. About three-quarters of the 271 transcription factors we identified are two-domain proteins, consisting of a DNA-binding domain along with a regulatory domain. The regulatory domains mainly bind small molecules. Many groups of transcription factors have identical domain architectures, and this implies that roughly three-quarters of the transcription factors have arisen as a consequence of gene duplication. In contrast, there is little evidence of duplication of regulatory regions together with regulated genes or of transcription factors together with regulated genes. Thirty-eight, out of the 121 transcription factors for which one or more regulated genes are known, regulate other transcription factors. This amplification effect, as well as large differences between the numbers of genes directly regulated by transcription factors, means that there are about 10 global regulators which each control many more genes than the other transcription factors.


Figures

Figure 1
Figure 1
Flow chart of the method used for identification of transcription factors. In addition to our set of 271 transcription factors, there are eight transcription factors without a DBD assignment that have known regulatory information.
Figure 2
Figure 2
(A) (Opposite and above) The three-dimensional structures of the 11 DBD families seen in the 271 identified transcription factors in E.coli. The figure highlights the fact that even though the helix–turn–helix motif occurs in all families except the nucleic acid binding family, the scaffolds in which the motif occurs are very different. (B) The 74 unique domain architectures of the 271 identified transcription factors. Each functional class is represented by a different shape and each family within the functional class is represented by a different colour. The DBDs are represented as rectangles. The partner domains are represented as hexagons (small molecule-binding domain), triangles (enzyme domains), circles (protein interaction domain), diamonds (domains of unknown function) and the receiver domain has a pentagonal shape. The letters A, R, D and U denote activators, repressors, dual regulators and transcription factors of unknown function, respectively, and the number of transcription factors of each type is given next to each domain architecture. Architectures of known three- dimensional structure are denoted by asterisks, and ‘+’ are cases where the regulatory function of a transcription factor has been inferred by indirect methods, so that the DNA-binding site is not known. The key to this figure, with the name of each family, is available as supplementary data from the website.
Figure 2
Figure 2
(A) (Opposite and above) The three-dimensional structures of the 11 DBD families seen in the 271 identified transcription factors in E.coli. The figure highlights the fact that even though the helix–turn–helix motif occurs in all families except the nucleic acid binding family, the scaffolds in which the motif occurs are very different. (B) The 74 unique domain architectures of the 271 identified transcription factors. Each functional class is represented by a different shape and each family within the functional class is represented by a different colour. The DBDs are represented as rectangles. The partner domains are represented as hexagons (small molecule-binding domain), triangles (enzyme domains), circles (protein interaction domain), diamonds (domains of unknown function) and the receiver domain has a pentagonal shape. The letters A, R, D and U denote activators, repressors, dual regulators and transcription factors of unknown function, respectively, and the number of transcription factors of each type is given next to each domain architecture. Architectures of known three- dimensional structure are denoted by asterisks, and ‘+’ are cases where the regulatory function of a transcription factor has been inferred by indirect methods, so that the DNA-binding site is not known. The key to this figure, with the name of each family, is available as supplementary data from the website.
Figure 3
Figure 3
The transcription factor regulatory network in E.coli. When more than one transcription factor regulates a gene, the order of their binding sites is as given in the figure. An arrowhead is used to indicate positive regulation when the position of the binding site is known. A horizontal bar is used to indicate negative regulation when the position of the binding site is known. In cases where only the nature of regulation is known, without binding site information, + and – are used to indicate positive and negative regulation, respectively. These examples may be indirect rather than direct regulation. The DBD families are indicated by circles of different colours as given in the key. The names of global regulators are in bold.
Figure 4
Figure 4
Direct and indirect gene regulation by E.coli transcription factors. The direct number of genes regulated is represented on the x axis and the indirect number of genes on the y axis. The global regulators, which are marked on the graph regulate a large number of genes, and participate in regulatory cascades, resulting in indirect regulation of genes.
Figure 5
Figure 5
Distribution of the number of transcription factors regulating a gene. Numbers in parentheses represent the number of operons.
Figure 6
Figure 6
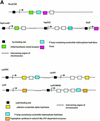
(Opposite and above) Duplication of regulatory modules in the network. (A) Two sets of homologous genes regulated by the same transcription factor. In the first example, three genes forming part of the same operon are homologous to three genes in separate operons, all regulated by fur. (B) Two examples of homologous genes regulated by the same pair of transcription factors. In the second example, even though hupA and hupB are both regulated by FIS, this transcription factor is an activator in one case and a repressor in another. (C) Two examples of duplication of regulatory modules of transcription factors and regulated genes. All genes are involved in the breakdown of various sugars.
Figure 6
Figure 6
(Opposite and above) Duplication of regulatory modules in the network. (A) Two sets of homologous genes regulated by the same transcription factor. In the first example, three genes forming part of the same operon are homologous to three genes in separate operons, all regulated by fur. (B) Two examples of homologous genes regulated by the same pair of transcription factors. In the second example, even though hupA and hupB are both regulated by FIS, this transcription factor is an activator in one case and a repressor in another. (C) Two examples of duplication of regulatory modules of transcription factors and regulated genes. All genes are involved in the breakdown of various sugars.

Similar articles

Cited by

References

    1. Perez-Rueda E. and Collado-Vides,J. (2000) The repertoire of DNA-binding transcriptional regulators in Escherichia coli K-12. Nucleic Acids Res., 28, 1838–1847. - PMC - PubMed
    1. Perez-Rueda E. and Collado-Vides,J. (2001) Common history at the origin of the position-function correlation in transcriptional regulators in archaea and bacteria. J. Mol. Evol., 53, 172–179. - PubMed
    1. Thieffry D., Huerta,A.M., Perez-Rueda,E. and Collado-Vides,J. (1998) From specific gene regulation to genomic networks: a global analysis of transcriptional regulation in Escherichia coli. Bioessays, 20, 433–440. - PubMed
    1. Shen-Orr S.S., Milo,R., Mangan,S. and Alon,U. (2002) Network motifs in the transcriptional regulation network of Escherichia coli. Nature Genet., 31, 64–68. - PubMed
    1. Guelzim N., Bottani,S., Bourgine,P. and Kepes,F. (2002) Topological and causal structure of the yeast transcriptional regulatory network. Nature Genet., 31, 60–63. - PubMed

Publication types

MeSH terms