Regulation of peroxisome proliferator-activated receptor gamma coactivator 1 alpha (PGC-1 alpha ) and mitochondrial function by MEF2 and HDAC5
- PMID: 12578979
- PMCID: PMC149898
- DOI: 10.1073/pnas.0337639100
Regulation of peroxisome proliferator-activated receptor gamma coactivator 1 alpha (PGC-1 alpha ) and mitochondrial function by MEF2 and HDAC5
Abstract
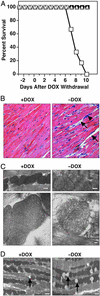
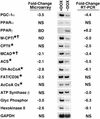
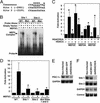
The myocyte enhancer factor-2 (MEF2) transcription factor regulates muscle development and calcium-dependent gene expression. MEF2 activity is repressed by class II histone deacetylases (HDACs), which dissociate from MEF2 when phosphorylated on two serine residues in response to calcium signaling. To explore the potential importance of MEF2/HDAC interactions in the heart, we generated transgenic mice expressing a signal-resistant form of HDAC5 under cardiac-specific and doxycycline-inducible regulation. Transgene expression resulted in sudden death in male mice accompanied by loss and morphologic changes of cardiac mitochondria and down-regulation of mitochondrial enzymes. The transcriptional coactivator PGC-1 alpha, a master regulator of mitochondrial biogenesis and fatty acid oxidation, was also down-regulated in response to HDAC5 expression. Examination of the PGC-1 alpha promoter revealed two MEF2-binding sites that mediate transcriptional activation by MEF2 and repression by HDAC5. These findings identify PGC-1 alpha as a key target of the MEF2/HDAC regulatory pathway and demonstrate this pathway's importance in maintenance of cardiac mitochondrial function.
Figures


Similar articles
-
Signal-dependent activation of the MEF2 transcription factor by dissociation from histone deacetylases.Proc Natl Acad Sci U S A. 2000 Apr 11;97(8):4070-5. doi: 10.1073/pnas.080064097. Proc Natl Acad Sci U S A. 2000. PMID: 10737771 Free PMC article.
-
Mitochondrial deficiency and cardiac sudden death in mice lacking the MEF2A transcription factor.Nat Med. 2002 Nov;8(11):1303-9. doi: 10.1038/nm789. Epub 2002 Oct 15. Nat Med. 2002. PMID: 12379849
-
Association with class IIa histone deacetylases upregulates the sumoylation of MEF2 transcription factors.Mol Cell Biol. 2005 Mar;25(6):2273-87. doi: 10.1128/MCB.25.6.2273-2287.2005. Mol Cell Biol. 2005. PMID: 15743823 Free PMC article.
-
Exercise and skeletal muscle glucose transporter 4 expression: molecular mechanisms.Clin Exp Pharmacol Physiol. 2006 Apr;33(4):395-9. doi: 10.1111/j.1440-1681.2006.04362.x. Clin Exp Pharmacol Physiol. 2006. PMID: 16620308 Review.
-
Class II histone deacetylases: structure, function, and regulation.Biochem Cell Biol. 2001;79(3):243-52. Biochem Cell Biol. 2001. PMID: 11467738 Review.
Cited by
-
Epigenetic modifications and noncoding RNAs in cardiac hypertrophy and failure.Nat Rev Cardiol. 2015 Aug;12(8):488-97. doi: 10.1038/nrcardio.2015.71. Epub 2015 May 12. Nat Rev Cardiol. 2015. PMID: 25962978 Review.
-
Transcription Factor Movement and Exercise-Induced Mitochondrial Biogenesis in Human Skeletal Muscle: Current Knowledge and Future Perspectives.Int J Mol Sci. 2022 Jan 28;23(3):1517. doi: 10.3390/ijms23031517. Int J Mol Sci. 2022. PMID: 35163441 Free PMC article. Review.
-
Peroxisome proliferator-activated receptor gamma coactivator 1 alpha promoter polymorphisms are associated with early-onset type 2 diabetes mellitus in the Korean population.Diabetologia. 2005 Jul;48(7):1323-30. doi: 10.1007/s00125-005-1793-4. Epub 2005 Jun 4. Diabetologia. 2005. PMID: 15937669
-
Functional crosstalk of PGC-1 coactivators and inflammation in skeletal muscle pathophysiology.Semin Immunopathol. 2014 Jan;36(1):27-53. doi: 10.1007/s00281-013-0406-4. Epub 2013 Nov 21. Semin Immunopathol. 2014. PMID: 24258516 Review.
-
Stem cells, phenotypic inversion, and differentiation.Int J Clin Exp Med. 2008;1(1):2-21. Epub 2008 Jan 20. Int J Clin Exp Med. 2008. PMID: 19079683 Free PMC article.
References
Publication types
MeSH terms
Substances
LinkOut - more resources
Full Text Sources
Other Literature Sources
Molecular Biology Databases

