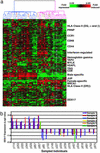
Individuality and variation in gene expression patterns in human blood
- PMID: 12578971
- PMCID: PMC149930
- DOI: 10.1073/pnas.252784499
Individuality and variation in gene expression patterns in human blood
Abstract
The nature and extent of interindividual and temporal variation in gene expression patterns in specific cells and tissues is an important and relatively unexplored issue in human biology. We surveyed variation in gene expression patterns in peripheral blood from 75 healthy volunteers by using cDNA microarrays. Characterization of the variation in gene expression in healthy tissue is an essential foundation for the recognition and interpretation of the changes in these patterns associated with infections and other diseases, and peripheral blood was selected because it is a uniquely accessible tissue in which to examine this variation in patients or healthy volunteers in a clinical setting. Specific features of interindividual variation in gene expression patterns in peripheral blood could be traced to variation in the relative proportions of specific blood cell subsets; other features were correlated with gender, age, and the time of day at which the sample was taken. An analysis of multiple sequential samples from the same individuals allowed us to discern donor-specific patterns of gene expression. These data help to define human individuality and provide a database with which disease-associated gene expression patterns can be compared.
Figures


Similar articles
-
Variation in gene expression profiles of peripheral blood mononuclear cells from healthy volunteers.Physiol Genomics. 2005 Aug 11;22(3):402-11. doi: 10.1152/physiolgenomics.00080.2005. Epub 2005 Jul 12. Physiol Genomics. 2005. PMID: 16014386
-
Comparison of different isolation techniques prior gene expression profiling of blood derived cells: impact on physiological responses, on overall expression and the role of different cell types.Pharmacogenomics J. 2004;4(3):193-207. doi: 10.1038/sj.tpj.6500240. Pharmacogenomics J. 2004. PMID: 15037859
-
Individual-specific variation of gene expression in peripheral blood leukocytes.Genomics. 2004 Jun;83(6):980-8. doi: 10.1016/j.ygeno.2003.12.013. Genomics. 2004. PMID: 15177552
-
[Transcriptomes for serial analysis of gene expression].J Soc Biol. 2002;196(4):303-7. J Soc Biol. 2002. PMID: 12645300 Review. French.
-
Global profiling of gene expression in cancer using genomics and proteomics.Curr Opin Mol Ther. 2001 Dec;3(6):538-45. Curr Opin Mol Ther. 2001. PMID: 11804268 Review.
Cited by
-
Signature Proteins in Small Extracellular Vesicles of Granulocytes and CD4+ T-Cell Subpopulations Identified by Comparative Proteomic Analysis.Int J Mol Sci. 2024 Oct 9;25(19):10848. doi: 10.3390/ijms251910848. Int J Mol Sci. 2024. PMID: 39409176 Free PMC article.
-
Systemic lupus erythematosus genetics: insights into pathogenesis and implications for therapy.Nat Rev Rheumatol. 2024 Oct;20(10):635-648. doi: 10.1038/s41584-024-01152-2. Epub 2024 Sep 4. Nat Rev Rheumatol. 2024. PMID: 39232240 Review.
-
Regional European genetic ancestry predicts type I interferon level and risk of severe viral infection.QJM. 2024 Aug 1;117(8):581-588. doi: 10.1093/qjmed/hcae052. QJM. 2024. PMID: 38530799
-
Time- and sex-dependent delayed effects of acute radiation exposure manifest via miRNA dysregulation.iScience. 2024 Jan 11;27(2):108867. doi: 10.1016/j.isci.2024.108867. eCollection 2024 Feb 16. iScience. 2024. PMID: 38318389 Free PMC article.
-
GEOMETRIC STRUCTURE GUIDED MODEL AND ALGORITHMS FOR COMPLETE DECONVOLUTION OF GENE EXPRESSION DATA.Found Data Sci. 2022 Sep;4(3):441-466. doi: 10.3934/fods.2022013. Found Data Sci. 2022. PMID: 38250319 Free PMC article.
References
Publication types
MeSH terms
Substances
Grants and funding
LinkOut - more resources
Full Text Sources
Other Literature Sources
Medical

