

Coexpression of neighboring genes in Caenorhabditis elegans is mostly due to operons and duplicate genes
- PMID: 12566401
- PMCID: PMC420373
- DOI: 10.1101/gr.553803
Coexpression of neighboring genes in Caenorhabditis elegans is mostly due to operons and duplicate genes
Abstract
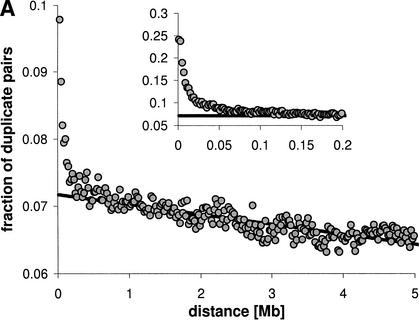
In many eukaryotic species, gene order is not random. In humans, flies, and yeast, there is clustering of coexpressed genes that cannot be explained as a trivial consequence of tandem duplication. In the worm genome this is taken a step further with many genes being organized into operons. Here we analyze the relationship between gene location and expression in Caenorhabditis elegans and find evidence for at least three different processes resulting in local expression similarity. Not surprisingly, the strongest effect comes from genes organized in operons. However, coexpression within operons is not perfect, and is influenced by some distance-dependent regulation. Beyond operons, there is a relationship between physical distance, expression similarity, and sequence similarity, acting over several megabases. This is consistent with a model of tandem duplicate genes diverging over time in sequence and expression pattern, while moving apart owing to chromosomal rearrangements. However, at a very local level, nonduplicate genes on opposite strands (hence not in operons) show similar expression patterns. This suggests that such genes may share regulatory elements or be regulated at the level of chromatin structure. The central importance of tandem duplicate genes in these patterns renders the worm genome different from both yeast and human.
Figures


Similar articles
-
A global analysis of Caenorhabditis elegans operons.Nature. 2002 Jun 20;417(6891):851-4. doi: 10.1038/nature00831. Nature. 2002. PMID: 12075352
-
Germline expression influences operon organization in the Caenorhabditis elegans genome.Genetics. 2009 Apr;181(4):1219-28. doi: 10.1534/genetics.108.099283. Epub 2009 Feb 9. Genetics. 2009. PMID: 19204375 Free PMC article.
-
Identification and analysis of internal promoters in Caenorhabditis elegans operons.Genome Res. 2007 Oct;17(10):1478-85. doi: 10.1101/gr.6824707. Epub 2007 Aug 21. Genome Res. 2007. PMID: 17712020 Free PMC article.
-
Operon and non-operon gene clusters in the C. elegans genome.WormBook. 2015 Apr 28:1-20. doi: 10.1895/wormbook.1.175.1. WormBook. 2015. PMID: 25936768 Free PMC article. Review.
-
Microarray analysis of variation in individual aging C. elegans: approaches and challenges.Exp Gerontol. 2006 Oct;41(10):1040-5. doi: 10.1016/j.exger.2006.06.034. Epub 2006 Jul 28. Exp Gerontol. 2006. PMID: 16876364 Review.
Cited by
-
Three decades of studies on chromosomal polymorphism of Drosophila willistoni and description of fifty different rearrangements.Genet Mol Biol. 2012 Dec;35(4 (suppl)):966-79. doi: 10.1590/s1415-47572012000600012. Epub 2012 Dec 18. Genet Mol Biol. 2012. PMID: 23411997 Free PMC article.
-
Gene Repositioning Is Under Constraints After Evolutionary Conserved Gene Neighborhood Separate.Front Genet. 2019 Oct 3;10:1030. doi: 10.3389/fgene.2019.01030. eCollection 2019. Front Genet. 2019. PMID: 31632448 Free PMC article.
-
Mammalian genes preferentially co-retained in radiation hybrid panels tend to avoid coexpression.PLoS One. 2012;7(2):e32284. doi: 10.1371/journal.pone.0032284. Epub 2012 Feb 24. PLoS One. 2012. PMID: 22384204 Free PMC article.
-
OpWise: operons aid the identification of differentially expressed genes in bacterial microarray experiments.BMC Bioinformatics. 2006 Jan 13;7:19. doi: 10.1186/1471-2105-7-19. BMC Bioinformatics. 2006. PMID: 16412220 Free PMC article.
-
InPrePPI: an integrated evaluation method based on genomic context for predicting protein-protein interactions in prokaryotic genomes.BMC Bioinformatics. 2007 Oct 26;8:414. doi: 10.1186/1471-2105-8-414. BMC Bioinformatics. 2007. PMID: 17963500 Free PMC article.
References
-
- Blumenthal T. 1998. Gene clusters and polycistronic transcription in eukaryotes. BioEssays 20: 480-487. - PubMed
-
- Blumenthal T., Evans, D., Link, C.D., Guffanti, D., Lawson, D., Thierry-Mieg, J., Thierry-Mieg, D., Chiu, W.L., Duke, K., Kiraly, M., et al. 2002. A global analysis of the Caenorhabditis elegans operons. Nature 417: 851-854. - PubMed
-
- The C. elegans Sequencing Consortium 1998. Genome sequence of the nematode C. elegans: A platform for investigating biology. Science 282: 2012-2018. - PubMed
Publication types
MeSH terms
LinkOut - more resources
Full Text Sources