. 2003 Mar 15;547(Pt 3):665-89.
doi: 10.1113/jphysiol.2002.032714. Epub 2003 Jan 31.

Local routes revisited: the space and time dependence of the Ca2+ signal for phasic transmitter release at the rat calyx of Held

Affiliations

Local routes revisited: the space and time dependence of the Ca2+ signal for phasic transmitter release at the rat calyx of Held

Christoph J Meinrenken et al. J Physiol. .

Abstract

During the last decade, advances in experimental techniques and quantitative modelling have resulted in the development of the calyx of Held as one of the best preparations in which to study synaptic transmission. Here we review some of these advances, including simultaneous recording of pre- and postsynaptic currents, measuring the Ca2+ sensitivity of transmitter release, reconstructing the 3-D anatomy at the electron microscope (EM) level, and modelling the buffered diffusion of Ca2+ in the nerve terminal. An important outcome of these studies is an improved understanding of the Ca2+ signal that controls phasic transmitter release. This article illustrates the spatial and temporal aspects of the three main steps in the presynaptic signalling cascade: Ca2+ influx through voltage-gated calcium channels, buffered Ca2+ diffusion from the channels to releasable vesicles, and activation of the Ca2+ sensor for release. Particular emphasis is placed on how presynaptic Ca2+ buffers affect the Ca2+ signal and thus the amplitude and time course of the release probability. Since many aspects of the signalling cascade were first conceived with reference to the squid giant presynaptic terminal, we include comparisons with the squid model and revisit some of its implications. Whilst the characteristics of buffered Ca2+ diffusion presented here are based on the calyx of Held, we demonstrate the circumstances under which they may be valid for other nerve terminals at mammalian CNS synapses.


Figures
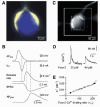
Figure 1
Figure 1. Membrane currents and volume-averaged [Ca2+]
A, pseudocolour image of a calyx of Held (yellow) and the medial nucleus of the trapezoid body (MNTB) principal cell (blue) in a brain slice. The calyx was filled with Lucifer Yellow, the principal cell with Cascade Blue (after Borst et al. 1995). B, time course of the signalling cascade, showing (top to bottom) the presynaptic AP waveform and resulting Ca2+ current, (inferred) release rate, postsynaptic EPSC and postsynaptic AP (after Borst et al. 1995; Borst & Sakmann, 1998). C, fluorescence image of a calyx in a brain slice. The calyx was filled with 1 mm Fura-2. D, fluorescence of Fura-2 in calyx (at two different concentrations) to measure volume-averaged [Ca2+]. Note that the measured decay of the fluorescent signal is much slower than the decay of calculated, local [Ca2+] transients (see Fig. 4). E, inverted whole-cell [Ca2+] amplitude (A−1) in calyx as a function of exogenous buffer Ca2+-binding ratio (κB). Regression line crosses x-axis at implied endogenous binding ratio ∼40 (CE reprinted after Helmchen et al. 1997).
Figure 4
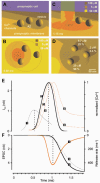
Figure 4. A minimal model of local, non-uniform Ca2+ signalling at the calyx
A, presynaptic membrane with active zone (AZ), calcium channel cluster, and three readily releasable vesicles. The location of cluster and vesicles, as well as the number of vesicles on the active zone, represent one example of random placement at multiple active zones. Drawings are to scale. B, as A but viewed from the top and with superimposed false colour coding of [Ca2+] on the membrane around the channel cluster. The concentrations reflect a simulation for the control case at time = 0.60 ms (see E). C, as B but viewed from the side, with an additional, vertical panel to show [Ca2+] in the plane perpendicular to the membrane (time = 1.15 ms). Dashed circle indicates a vesicle that has already fused. D, variable channel-to-vesicle distances result in [Ca2+] transients with variable peaks and thus heterogeneous release probability. AD are excerpts from a video ‘The Ca2+ signal controlling phasic transmitter release’, available from the authors or at: http://sunny.mpimf-heidelberg.mpg.de. E, AP (trace 1, time course only) and whole-cell Ca2+ current (as predicted by the Hodgkin–Huxley Model; trace 2, left axis). Red traces show two simulated [Ca2+] transients (right axis, each normalised to the same amplitude) the average across all vesicle positions (trace 3) and at 200 nm from the channel cluster (trace 4). The first vertical dashed line from left indicates the time of peak AP (0.54 ms), and the second line indicates the time of peak Ca2+ influx (0.92 ms). F, predicted, average release rate of calyx (trace 1, right axis) and predicted EPSC (trace 2, left axis). For comparison, a measured, AP-evoked EPSC (Bollmann et al. 2000) is also shown (trace 3; shifted by ∼400 μs to the left to allow comparison of the time course). The vertical dashed line indicates the time of the peak of the predicted release rate (1.03 ms) (E and F after Meinrenken et al. 2002).
Figure 2
Figure 2. Ca2+ sensitivity and kinetic model for putative sensor
A, maximum release rates of calyx in response to step-increases of presynaptic, intracellular [Ca2+] (after Bollmann et al. 2000). B, cartoon of kinetic release model (Bollmann et al. 2000). The corresponding putative sensor binds 5 Ca2+ (a and b; reversible), then switches to a release-promoting state (c; reversible), and finally triggers the fusion of the releasable vesicle (d; irreversible). C, simulation of release rate and EPSC (thin line) evoked by a brief increase of intracellular [Ca2+]. Rate and EPSC were shifted by 250 μs to the right, to allow comparison to a measured, AP-evoked EPSC (thick line) (after Bollmann et al. 2000). D, model-predicted vesicle release probability (Pr, vesicle) (Bollmann et al. 2000) in response to a hypothetical [Ca2+] transient with the same time course as that of ICa (∼Gaussian, fwhm = 383 μs) and an amplitude of [Ca2+]vesicle (after Meinrenken et al. 2002).
Figure 3
Figure 3. 3-D reconstruction of calyx anatomy at the EM level
A, 3-D EM reconstruction of a single calyx (yellow) and its medial nucleus of the trapezoid body (MNTB) principal cell (blue). B, contour-lined single-sectional cut through A, showing individual AZs (red) and puncta adhaerentia (magenta). C, 3-D view of a cluster of vesicles (green) at a single AZ (red). Scale: vesicle diameter, 45 nm. D, electron micrograph through single active zone, showing the pre- and postsynaptic (bottom) membrane, as well as anatomically docked and non-docked vesicles (AC after Sätzler et al. 2002).
Figure 5
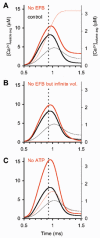
Figure 5. Effects of endogenous buffers on [Ca2+] transients
Predicted [Ca2+] transients for different, hypothetical buffer conditions. Thick traces, [Ca2+] averaged across all vesicle positions (30–300 nm from channel cluster, left axes). Thin traces, [Ca2+] averaged across calyx volume (right axis). Black traces show control condition (ATP and EFB, in AC). The vertical dashed line indicates the time of peak Ca2+ influx (0.92 ms). Red traces show hypothetical buffer conditions (different in AC). A, no EFB (ATP only). B, as A but assuming the calyx to have infinite volume. C, no ATP (EFB only).
Figure 6
Figure 6. Measuring [Ca2+] transients via fluorescent Ca2+ buffers
Simulation of local and volume-averaged [Ca2+] dynamics (red traces), probed with a low concentration (1 nm) of the low-affinity Ca2+ dye MagFura-2 (black traces). The vertical dashed line indicates the peak time of the Ca2+ current. Except for the presence of the dye, all conditions were the same as in Fig. 4, including the Ca2+ current (trace 1, right axis). Trace 2 shows the predicted volume-averaged [Ca2+] (same as control case in Fig. 5). For comparison, trace 3 shows the predicted, volume-averaged concentration of Ca2+-bound MagFura-2 (after conversion into [Ca2+], see text), thus reporting an apparent [Ca2+] as it would be measured in experiments. For the same simulation, trace 4 shows the predicted average [Ca2+] in a more localised, hypothetical control volume, a circular disk of 250 nm diameter and 5 nm height centred around the calcium channel cluster (at 10 nm above the AZ). For the same control volume, trace 5 shows the apparent [Ca2+] reported by the dye. Since MagFura-2 is low-affinity, it reports the volume-averaged [Ca2+] in the terminal fairly accurately. For the smaller control volume, however, the reported [Ca2+] is much lower than the actual [Ca2+] and thus would underestimate the domain-like, local Ca2+ signals sensed by the releasable vesicles.
Figure 7
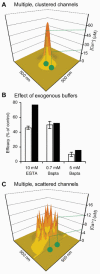
Figure 7. Local Ca2+ signalling in boutons of cortical pyramidal neurones
A, assumed reaction volume with AZ (300 nm diameter) on ‘bottom’ wall and assumed topography for a bouton on a layer 5 neurone (10 calcium channels in the cluster). False colours indicate spatial profile of the predicted [Ca2+] transients (at ∼10 nm above the membrane; snapshot at time of peak ICa, averaged over > 100 APs). The peak indicates the location of calcium channels. The average [Ca2+] across the AZ reaches a peak of 5.2 μm. The predicted average release probability is 11.8 % (the average for vesicles located randomly anywhere in AZ). B, predicted release-suppressing effect of EGTA and BAPTA (open bars) and comparison with experimental, EPSP-based data (black bars, Ohana & Sakmann, 2000; error bars show ± 1 s.e.m.). Except for the inclusion of BAPTA or EGTA, the simulation was the same as in A. Since channel-to-vesicle distances vary, 10 mm EGTA and 0.7 mm BAPTA have similar release-suppressing effects despite their different buffer products (see text). C, assumed topography for a bouton on a bitufted layer 2/3 neurone (10 calcium channels, of the same conductance as in A, but distributed evenly onthe AZ). The average [Ca2+] across the AZ reaches a peak of 4.4 μm. The predicted average release probability is 7.9 %. A and C show that even in volumes as small as (500 nm)3, local Ca2+ signals arising from an AZ near the centre of the releasing membrane dissipate before reaching the non-innervating membranes. Therefore, the Ca2+ signals near the releasable vesicles are not affected by the actual shape of the terminal, but only by the ‘local’ parameters topography, channel conductance, and diffusion/buffering.

Similar articles

Cited by

References

    1. Adams DJ, Takeda K, Umbach JA. Inhibitors of calcium buffering depress evoked transmitter release at the squid giant synapse. J Physiol. 1985;369:145–159. - PMC - PubMed
    1. Adler EM, Augustine GJ, Duffy SN, Charlton MP. Alien intracellular calcium chelators attenuate neurotransmitter release at the squid giant synapse. J Neurosci. 1991;11:1496–1507. - PMC - PubMed
    1. Albritton NL, Meyer T, Stryer L. Range of messenger action of calcium ion and inositol 1,4,5-triphosphate. Science. 1992;258:1812–1815. - PubMed
    1. Augustine GJ. How does calcium trigger neurotransmitter release? Curr Opin Neurobiol. 2001;11:320–326. - PubMed
    1. Augustine GJ, Charlton MP. Calcium dependence of presynaptic calcium current and post-synaptic response at the squid giant synapse. J Physiol. 1986;381:619–640. - PMC - PubMed

LinkOut - more resources