. 2003 Jan;14(1):107-17.
doi: 10.1091/mbc.e02-07-0376.

Time-lapse imaging reveals dynamic relocalization of PP1gamma throughout the mammalian cell cycle

Affiliations

Time-lapse imaging reveals dynamic relocalization of PP1gamma throughout the mammalian cell cycle

Laura Trinkle-Mulcahy et al. Mol Biol Cell. 2003 Jan.

Abstract

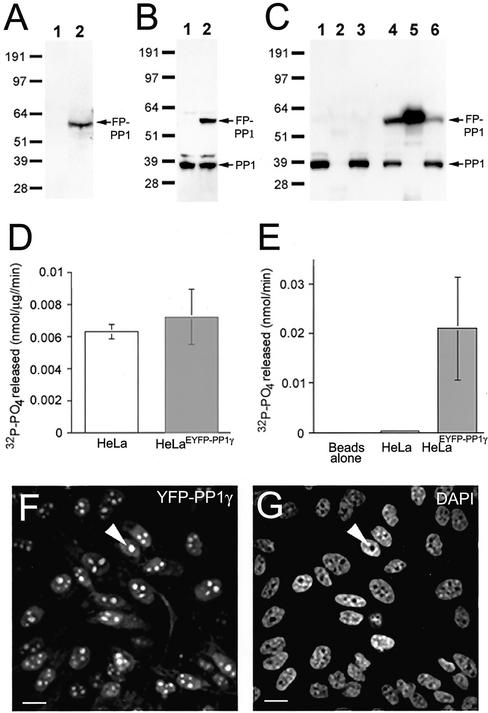
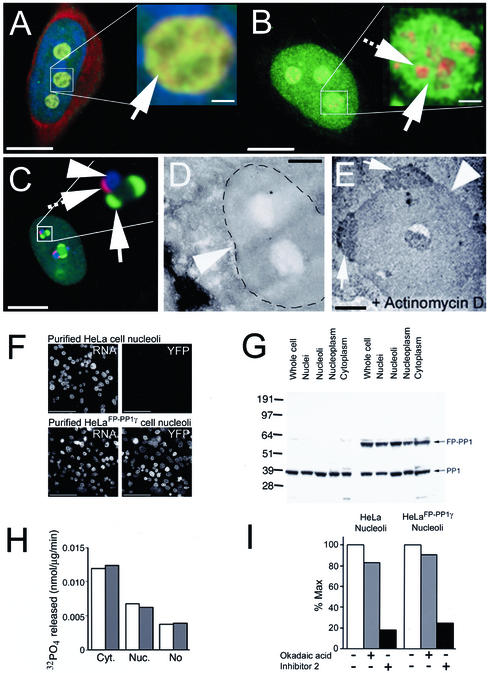
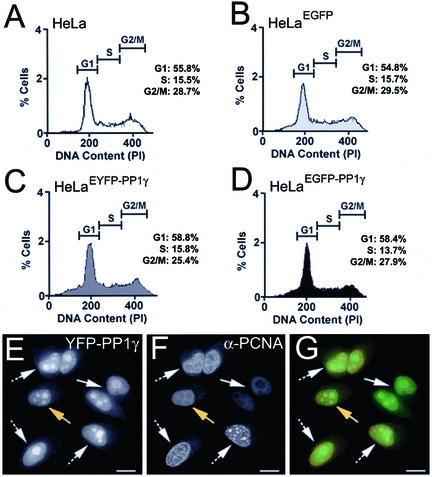
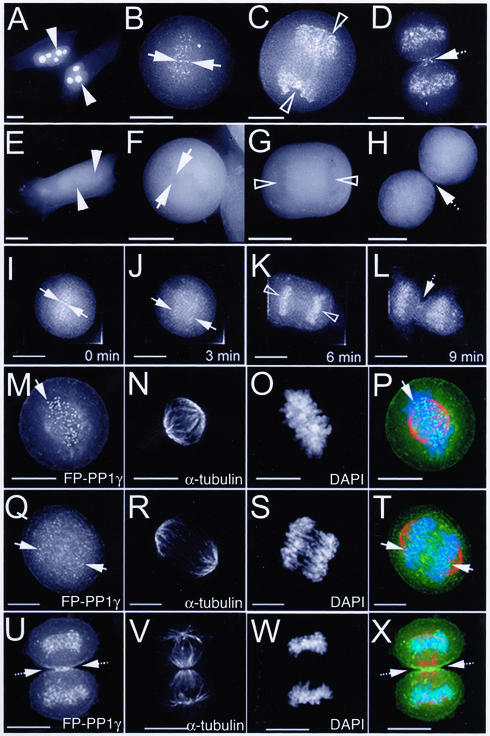
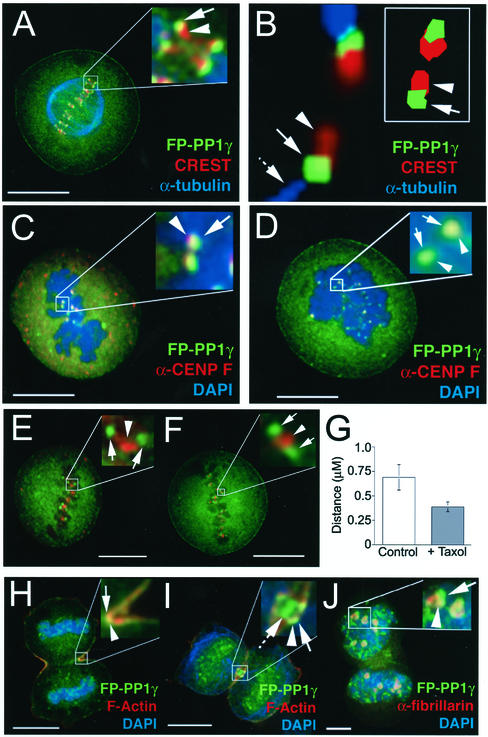
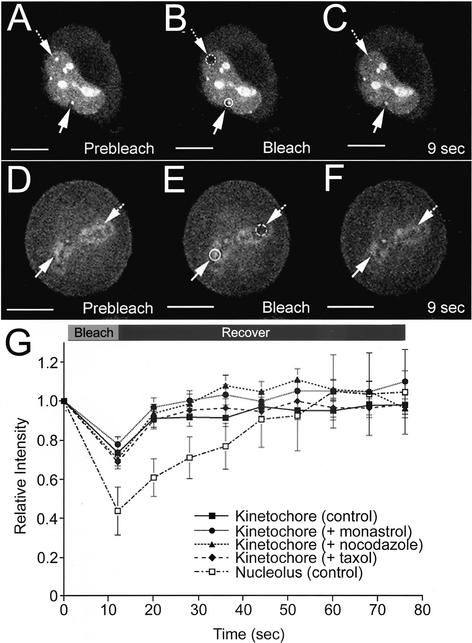
Protein phosphatase 1 (PP1) is a ubiquitous serine/threonine phosphatase that regulates many cellular processes, including cell division. When transiently expressed as fluorescent protein (FP) fusions, the three PP1 isoforms, alpha, beta/delta, and gamma1, are active phosphatases with distinct localization patterns. We report here the establishment and characterization of HeLa cell lines stably expressing either FP-PP1gamma or FP alone. Time-lapse imaging reveals dynamic targeting of FP-PP1gamma to specific sites throughout the cell cycle, contrasting with the diffuse pattern observed for FP alone. FP-PP1gamma shows a nucleolar accumulation during interphase. On entry into mitosis, it localizes initially at kinetochores, where it exchanges rapidly with the diffuse cytoplasmic pool. A dramatic relocalization of PP1 to the chromosome-containing regions occurs at the transition from early to late anaphase, and by telophase FP-PP1gamma also accumulates at the cleavage furrow and midbody. The changing spatio-temporal distribution of PP1gamma revealed using the stable PP1 cell lines implicates it in multiple processes, including nucleolar function, the regulation of chromosome segregation and cytokinesis.


Figures

Figure 1
Figure 1
HeLaEYFP-PP1γ cells express full-length, active fusion protein. (A) Lysates (30 μg total protein) from HeLa (1) and HeLaEYFP-PP1γ (2) cells probed on a Western blot with anti-GFP antibodies. (B) Similar lysates probed with anti-PP1 antibodies. (C) HeLa and HeLaEYFP-PP1γ cell lysates before (1 and 4) and after (3 and 6) incubation with anti-GFP antibodies coupled to protein G sepharose. Anti-PP1 antibodies detect endogenous PP1 in both lysates and the fusion protein in the HeLaEYFP-PP1γ lysate. The fusion protein was specifically immunodepleted by >50% from HeLaEYFP-PP1γ lysates (5), whereas no PP1-positive bands were pulled down from HeLa lysates (2). (D) Total in vitro phosphorylase, a phosphatase activity associated with HeLa and HeLaEYFP-PP1γ cell lysates. (E) Phosphatase activity associated with anti-GFP beads alone and with anti-GFP beads incubated with 50 μg total protein from HeLa or HeLaEYFP-PP1γ cell lysates. Data are means ± SD for n = 4. The EYFP signal in a field of HeLaEYFP-PP1γ cells is shown in F, with the DAPI-stained DNA pattern in G. A nucleolus is marked by the arrowhead. Scale bar, 10 μM.
Figure 2
Figure 2
Purification and characterization of FP-PP1γ- enriched nucleoli from HeLaEYFP-PP1γ cells. (A) HeLaEYFP-PP1γ cell fixed and stained with DAPI for DNA (blue) and Pyronin Y for RNA (red). FP-PP1γ (green) colocalizes with the Pyronin Y–stained RNA in the granular compartment. Inset: an enlarged nucleolus, with the granular compartment indicated by an arrow. (B) HeLaEYFP-PP1γ cell fixed and stained with antifibrillarin (red) to mark the dense fibrillar component of the nucleolus. Nucleolar FP-PP1γ (green) is spatially distinct from this compartment, as shown clearly in the enlarged inset. The arrow indicates FP-PP1γ in the granular component, whereas the hashed arrow points to the dense fibrillar component labeled by antifibrillarin. (C) HeLaEYFP-PP1γ cell treated with actinomycin D. The nucleolus in the enlarged inset shows the spatial distinction between the perinucleolar caps caused by FP-PP1γ (green, arrow), fibrillarin (blue, arrowhead) and p80 coilin (red, hashed arrow). (D) Transmission electron micrograph of a nucleolus (arrowhead) from a HeLaEYFP-PP1γ cell. (E) Similar micrograph of a nucleolus (arrowhead) from an actinomycin d--treated HeLaEYFP-PP1γ cell. Perinucleolar caps containing FP-PP1γ were detected using anti-GFP antibodies and are marked by arrows. (F) Nucleoli were purified from HeLa and HeLaEYFP-PP1γ cells. rRNA is stained with Pyronin Y, and a YFP signal is only detected in the HeLaEYFP-PP1γ nucleoli. (G) Cellular fractions (30 μg total protein per lane) from HeLa (lanes 1–5) and HeLaEYFP-PP1γ (lanes 6–10) cells probed on a Western blot with anti-PP1γ antibodies. The fractions probed include whole cell lysates (1, 6), nuclei (2, 7), nucleoli (3, 8), nucleoplasm (4, 9), and cytoplasm (5, 10). (H) Total in vitro phosphorylase a phosphatase activity associated with HeLa (white bars) and HeLaEYFP-PP1γ (gray bars) cytoplasmic, nucleoplasmic, and nucleolar fractions. (I) Sensitivity of nucleolar phosphatase activity to inhibitors that distinguish between PP1 (Inhibitor 2-sensitive) and PP2A (low level okadaic acid-sensitive). Activity is expressed relative to maximal activity in the absence of inhibitors. All phosphatase assays were repeated twice (each time in duplicate) with similar results.
Figure 3
Figure 3
Cell cycle distribution of HeLaFP-PP1γ cells. A-D: Distribution of cells in G1, S and G2/M for the parental HeLa (A), HeLaEGFP (B), HeLaEYFP-PP1γ (C), and HeLaEGFP-PP1γ (D) cell lines, as determined by FACS analysis. HeLaEYFP-PP1γ cells (E) were stained with anti-PCNA (F) to mark cell cycle stages, and the two signals are shown merged in G. Cells in G1 are indicated by an arrow, those in S-phase by a hashed arrow, and those in G2 by a yellow arrow. Scale bar, 10 μM.
Figure 4
Figure 4
Dynamic distribution of FP-PP1γ throughout cell division. Live HeLaEYFP-PP1γ (A–D) and HeLaEGFP (E–H) cells were imaged using a Deltavision restoration microscope. All images shown here are 2D maximum projections of Z-series data. In interphase cells (A and E), nucleoli are marked by arrowheads. Regions of condensed chromatin are marked by arrows in metaphase cells (B, F) and by open arrowheads in anaphase cells (C and G). The spindle midzone region is marked by a hashed arrow in telophase cells (D and H). Time-lapse imaging of a single mitotic HeLaEYFP-PP1γ cell confirms these patterns and reveals the short time period over which they occur (I–L). Mitotic HeLaEYFP-PP1γ cells were also fixed and stained with anti–α-tubulin to mark spindles (N, R, and V) and DAPI to mark chromosomes (O, S, and W). The FP-PP1γ signal (M, Q, and U) is shown for cells in metaphase (M–P), early anaphase (Q–T), and telophase (U–X). All three patterns are shown merged in P, T and X. Scale bar, 10 μM.
Figure 5
Figure 5
FP-PP1γ accumulates at kinetochores, cleavage furrow, and midbody. (A) HeLaEYFP-PP1γ metaphase cell stained with anti–α-tubulin to marker mitotic spindles, and with CREST, a centromere marker. FP-PP1γ foci are marked by arrows and centromeres by arrowheads. (B) High-resolution image of a pair of centromeres from a HeLaEYFP-PP1γ metaphase cell stained with anti–α-tubulin and CREST. The spatial orientation of the FP-PP1γ signal (arrowhead) with respect to the end of the spindle fiber (hashed arrow) and the centromere (arrowhead) can be clearly seen. The inset shows a 2D model of a single section through a pair of centromeres, which reveals a slight overlap between the FP-PP1γ and CREST signals. (C and D) HeLaEYFP-PP1γ metaphase cells stained with DAPI and anti-CENP F, a kinetochore marker. FP-PP1γ foci (arrow) colocalize with kinetochores (arrowhead) both in control cells (C) and in cells treated with nocodazole to disrupt microtubules (D). (E and F) HeLaEYFP-PP1γ metaphase cells stained with anti–aurora B, a markerfor the inner centromere region. FP-PP1γ foci are marked by arrows and the inner centromere region by an arrowhead. The spatial distinction between the two signals is maintained both in control cells (E) and when cells are treated with taxol to release tension on kinetochores (F). The release of tension can be quantitated as a reduction in the mean distance between paired kinetochores marked by FP-PP1γ (G; n = 57). (H) HeLaEYFP-PP1γ telophase cell stained with DAPI and rhodamine-phalloidin, to visualize F-actin. FP-PP1γ accumulates at the cleavage furrow (arrow), colocalized with F-actin (arrowhead). (I) A cell at a later stage of telophase, where the cortical accumulation of FP-PP1γ (arrow) remains colocalized with F-actin (arrowhead) in a ring-like structure at the junction between the two daughter cells, with an additional accumulation of FP-PP1γ at the midbody (hashed arrow). (J) A cell in which nucleoli are starting to reform, as indicated by an antibody to the nucleolar protein fibrillarin (arrowhead). FP-PP1γ is starting to reaccumulate in nucleoli (arrow), which is its predominant interphase localization pattern. Scale bars, 10 μM.
Figure 6
Figure 6
Nucleolar and kinetochore pools of FP-PP1γ show rapid turnover rates. Live HeLaEYFP-PP1γ cells were subjected to FRAP experiments in which a specific pool of EYFP-PP1γ was photobleached and recovery of fluorescent signal monitored over time. For the interphase HeLaEYFP-PP1γ cell shown in A–C, a nucleolus (hashed circle/arrow) was photobleached, whereas a nonbleached nucleolus (circle/arrow) was monitored for comparison. The signal recovered by ∼50% in 9 s (C). The experiment was repeated three times, and a plot of signal recovery over time for a bleached nucleolus normalized to a nonbleached nucleolus in the same cell is shown (G; □), with each time point presented as mean relative intensity ± SD. For the metaphase HeLaEYFP-PP1γ cell shown in D–F, a kinetochore region (hashed circle/arrow) was photobleached, whereas a nonbleached kinetochore region (circle/arrow) was monitored for comparison. The signal showed an apparent full recovery by 9 s (F). The experiment was repeated five times, and a plot of signal recovery over time for a bleached kinetochore normalized to a nonbleached kinetochore in the same cell is shown (G; ▪), with each time point presented as mean relative intensity ± SD. Similar recovery kinetics were observed for this intracellular pool when HeLaEYFP-PP1γ cells were treated with monastrol to inhibit the Eg5 mitotic kinesin (G; ●, n = 3), with nocodazole to disrupt microtubules (G; ▴, n = 4) or with taxol to release tension on kinetochores (G; ♦, n = 4). Scale bars, 10 μM.

Similar articles

Cited by

References

    1. Andersen JS, Lyon CE, Fox AH, Leung AK, Lam YW, Steen H, Mann M, Lamond AI. Directed proteomic analysis of the human nucleolus. Curr Biol. 2002;12:1–11. - PubMed
    1. Andreassen PR, Lacroix FB, Villa-Moruzzi E, Margolis RL. Differential subcellular localization of protein phosphatase-1 alpha, gamma1, and delta isoforms during both interphase and mitosis in mammalian cells. J Cell Biol. 1998;141:1207–1215. - PMC - PubMed
    1. Barker HM, Brewis ND, Street AJ, Spurr NK, Cohen PT. Three genes for protein phosphatase 1 map to different human chromosomes: sequence, expression and gene localization of protein serine/threonine phosphatase 1 beta (PPP1CB) Biochim Biophys Acta. 1994;1220:212–218. - PubMed
    1. Barker HM, Craig SP, Spurr NK, Cohen PT. Sequence of human protein serine/threonine phosphatase 1 gamma and localization of the gene (PPP1CC) encoding it to chromosome bands 12q24.1-q24.2. Biochim Biophys Acta. 1993;1178:228–233. - PubMed
    1. Berndt N, Dohadwala M, Liu CW. Constitutively active protein phosphatase 1alpha causes Rb-dependent G1 arrest in human cancer cells. Curr Biol. 1997;7:375–386. - PubMed

Publication types

MeSH terms

Substances

LinkOut - more resources