. 2003 Jan;13(1):64-72.
doi: 10.1101/gr.817703.

Distinguishing regulatory DNA from neutral sites

Affiliations

Distinguishing regulatory DNA from neutral sites

Laura Elnitski et al. Genome Res. 2003 Jan.

Abstract

We explore several computational approaches to analyzing interspecies genomic sequence alignments, aiming to distinguish regulatory regions from neutrally evolving DNA. Human-mouse genomic alignments were collected for three sets of human regions: (1) experimentally defined gene regulatory regions, (2) well-characterized exons (coding sequences, as a positive control), and (3) interspersed repeats thought to have inserted before the human-mouse split (a good model for neutrally evolving DNA). Models that potentially could distinguish functional noncoding sequences from neutral DNA were evaluated on these three data sets, as well as bulk genome alignments. Our analyses show that discrimination based on frequencies of individual nucleotide pairs or gaps (i.e., of possible alignment columns) is only partially successful. In contrast, scoring procedures that include the alignment context, based on frequencies of short runs of alignment columns, dramatically improve separation between regulatory and neutral features. Such scoring functions should aid in the identification of putative regulatory regions throughout the human genome.


Figures

Figure 1.
Figure 1.
(A) Cumulative distributions of ASPC (alignment score per column) in 200-bp nonoverlapping windows from regulatory elements, ancient repeats, coding exons (cds), and bulk DNA alignments. The ASPC is calculated using the BLASTZ scoring scheme with a penalty for gaps. The vertical line represents the ASPC value at which regulatory element and ancient repeat distributions intersect (i.e., maximal distance between cumulative distributions). With this as a threshold, one obtains a certain percentage of false positives (ancient repeats above the threshold) and false negatives (regulatory elements above the threshold). (B) Cumulative distributions of gap density in 200-bp nonoverlapping windows from regulatory elements, ancient repeats, coding exons (cds), and bulk DNA alignments. The vertical line and percentages of false positives and false negatives are obtained as for ASPC in A, except that here false positives are ancient repeats below the threshold, and false negatives are regulatory elements above it.
Figure 1.
Figure 1.
(A) Cumulative distributions of ASPC (alignment score per column) in 200-bp nonoverlapping windows from regulatory elements, ancient repeats, coding exons (cds), and bulk DNA alignments. The ASPC is calculated using the BLASTZ scoring scheme with a penalty for gaps. The vertical line represents the ASPC value at which regulatory element and ancient repeat distributions intersect (i.e., maximal distance between cumulative distributions). With this as a threshold, one obtains a certain percentage of false positives (ancient repeats above the threshold) and false negatives (regulatory elements above the threshold). (B) Cumulative distributions of gap density in 200-bp nonoverlapping windows from regulatory elements, ancient repeats, coding exons (cds), and bulk DNA alignments. The vertical line and percentages of false positives and false negatives are obtained as for ASPC in A, except that here false positives are ancient repeats below the threshold, and false negatives are regulatory elements above it.
Figure 2.
Figure 2.
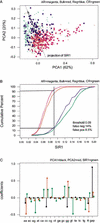
First principal plane projection for frequencies on a 17-symbol alphabet comprising all A, C, G, T pairings plus an additional symbol for gaps. The data cloud contains 93 regulatory elements (Reg), plus 200 alignment segments of size 200 bp randomly selected from each of ancient repeats (AR), coding exons (CR), and bulk DNA (shown as different marks). Percentages of explained variability are reported for the first and second principal component (total for the plane, 82%). The black line is a projection of SIR1 (see B) on the first principal plane. (B) Cumulative distributions of SIR1 (first Sliced Inverse Regression linear combination) for frequencies on the 17-symbol alphabet. The distributions concern 93 regulatory elements (Reg), plus 200 alignment segments of size 200 bp randomly selected from each of ancient repeats (AR), coding exons (CR), and bulk DNA. The vertical line and percentages of false positives (ancient repeats above the threshold) and false negatives (regulatory elements below the threshold) are obtained as for ASPC in Figure 1A. (C) Coefficients of the linear combinations expressing first (black) and second (red) principal components, and first SIR direction (green). These are eigenvectors from spectral decompositions of appropriate variance/covariance matrices (see Methods and Table 1). Thus, each has norm 1 vector (the squares of the coefficients add up to 1), and PCA1 and PCA2, which come from the same decomposition, are orthogonal (the cross products add up to 0).
Figure 3.
Figure 3.
(A) Cumulative distributions of exact hexamer matches density in 200-bp nonoverlapping windows from regulatory elements, ancient repeats, exons, and bulk DNA alignments. The density is calculated by scrolling over 6-nt sequences with no gaps in each window. Vertical line and percentages of false positives (ancient repeats above the threshold) and false negatives (regulatory elements below the threshold) are obtained as for ASPC in Figure 1A. (B) Cumulative distributions of (normalized) log-odds score from fifth-order 5-symbol alphabet Markov Models. The score expression is derived based on 93 regulatory elements and 200 alignment segments of size 200 bp randomly selected from ancient repeats. The cumulative distributions for these are shown in dark blue and magenta, respectively. Because the distributions do not intersect, any threshold between the maximum score value for ancient repeats and the minimum score value for regulatory elements guarantees 0% false positives and 0% false negatives. The green, orange, purple, and bright blue cumulative distributions are obtained applying the score expression to segments from coding regions, UTRs, and bulk DNA.
Figure 3.
Figure 3.
(A) Cumulative distributions of exact hexamer matches density in 200-bp nonoverlapping windows from regulatory elements, ancient repeats, exons, and bulk DNA alignments. The density is calculated by scrolling over 6-nt sequences with no gaps in each window. Vertical line and percentages of false positives (ancient repeats above the threshold) and false negatives (regulatory elements below the threshold) are obtained as for ASPC in Figure 1A. (B) Cumulative distributions of (normalized) log-odds score from fifth-order 5-symbol alphabet Markov Models. The score expression is derived based on 93 regulatory elements and 200 alignment segments of size 200 bp randomly selected from ancient repeats. The cumulative distributions for these are shown in dark blue and magenta, respectively. Because the distributions do not intersect, any threshold between the maximum score value for ancient repeats and the minimum score value for regulatory elements guarantees 0% false positives and 0% false negatives. The green, orange, purple, and bright blue cumulative distributions are obtained applying the score expression to segments from coding regions, UTRs, and bulk DNA.

Similar articles

Cited by

References

    1. Altschul S.F., Madden, T.L., Schäffer, A.A., Zhang, J., Zhang, Z., Miller, W., and Lipman, D.J. 1997. Gapped BLAST and PSI-BLAST: A new generation of protein database search programs. Nucleic Acids Res. 25: 3389-3402. - PMC - PubMed
    1. Batzoglou S., Pachter, L., Mesirov, J.P., Berger, B., and Lander, E.S. 2000. Human and mouse gene structure: Comparative analysis and application to exon prediction. Genome Res. 10: 950-958. - PMC - PubMed
    1. Berman B.P., Nibu, Y., Pfeiffer, B.D., Tomancak, P., Celniker, S.E., Levine, M., Rubin, G.M., and Eisen, M.B. 2002. Exploiting transcription factor binding site clustering to identify cis-regulatory modules involved in pattern formation in the Drosophila gene. Proc. Natl. Acad. Sci. 99: 757-762. - PMC - PubMed
    1. Botcherby M. 2002. Harvesting the mouse genome. Comp. Funct. Genom. 3: 319-324. - PMC - PubMed
    1. Burge C. and Karlin, S. 1997. Prediction of complete gene structures in human genomic DNA. J. Mol. Biol. 268: 78-94. - PubMed

Publication types

LinkOut - more resources