

Digital karyotyping
- PMID: 12461184
- PMCID: PMC138581
- DOI: 10.1073/pnas.202610899
Digital karyotyping
Abstract
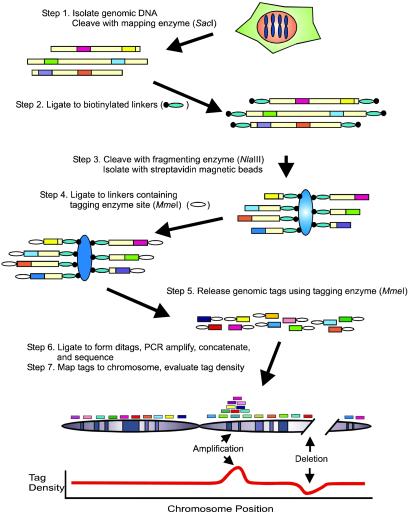
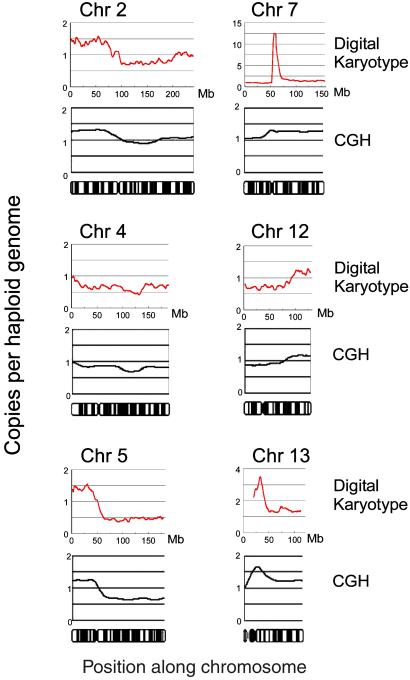
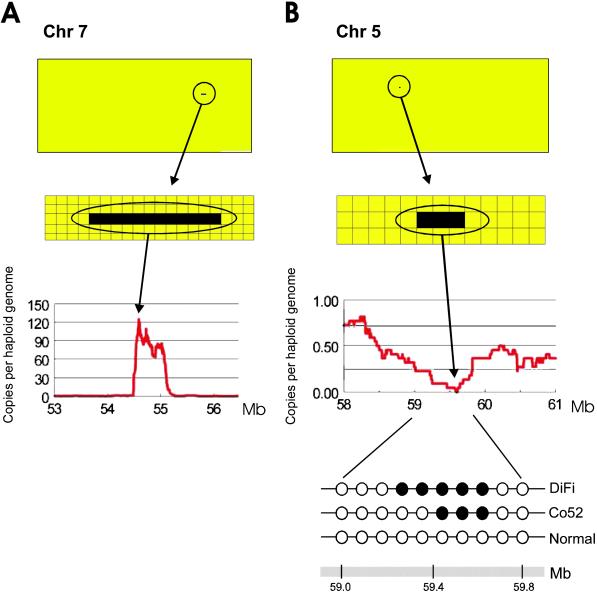
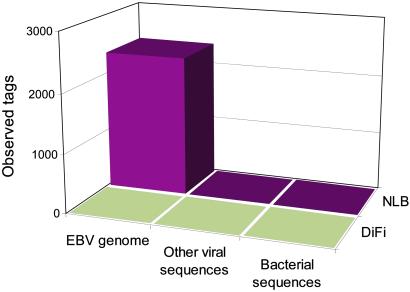
Alterations in the genetic content of a cell are the underlying cause of many human diseases, including cancers. We have developed a method, called digital karyotyping, that provides quantitative analysis of DNA copy number at high resolution. This approach involves the isolation and enumeration of short sequence tags from specific genomic loci. Analysis of human cancer cells by using this method identified gross chromosomal changes as well as amplifications and deletions, including regions not previously known to be altered. Foreign DNA sequences not present in the normal human genome could also be readily identified. Digital karyotyping provides a broadly applicable means for systematic detection of DNA copy number changes on a genomic scale.
Figures
Similar articles
-
Digital karyotyping.Nat Protoc. 2007;2(8):1973-86. doi: 10.1038/nprot.2007.276. Nat Protoc. 2007. PMID: 17703209
-
Digital karyotyping: an update of its applications in cancer.Mol Diagn Ther. 2006;10(4):231-7. doi: 10.1007/BF03256461. Mol Diagn Ther. 2006. PMID: 16884326
-
Frequent occurrence of uniparental disomy in colorectal cancer.Carcinogenesis. 2007 Jan;28(1):38-48. doi: 10.1093/carcin/bgl086. Epub 2006 Jun 13. Carcinogenesis. 2007. PMID: 16774939
-
Apply innovative technologies to explore cancer genome.Curr Opin Oncol. 2005 Jan;17(1):33-8. doi: 10.1097/01.cco.0000147382.97085.e4. Curr Opin Oncol. 2005. PMID: 15608510 Review.
-
DNA copy number amplifications in human neoplasms: review of comparative genomic hybridization studies.Am J Pathol. 1998 May;152(5):1107-23. Am J Pathol. 1998. PMID: 9588877 Free PMC article. Review.
Cited by
-
EPHA2 mutations with oncogenic characteristics in squamous cell lung cancer and malignant pleural mesothelioma.Oncogenesis. 2019 Sep 4;8(9):49. doi: 10.1038/s41389-019-0159-6. Oncogenesis. 2019. PMID: 31484920 Free PMC article.
-
The Current Status of Genes and Genetic Testing in Emergency Medicine: A Narrative Review.Adv J Emerg Med. 2019 Aug 25;4(1):e10. doi: 10.22114/ajem.v0i0.216. eCollection 2020 Winter. Adv J Emerg Med. 2019. PMID: 31938779 Free PMC article. Review.
-
Next-generation DNA sequencing of paired-end tags (PET) for transcriptome and genome analyses.Genome Res. 2009 Apr;19(4):521-32. doi: 10.1101/gr.074906.107. Genome Res. 2009. PMID: 19339662 Free PMC article. Review.
-
Relatively Small Contribution of Methylation and Genomic Copy Number Aberration to the Aberrant Expression of Inflammation-Related Genes in HBV-Related Hepatocellular Carcinoma.PLoS One. 2015 May 12;10(5):e0126836. doi: 10.1371/journal.pone.0126836. eCollection 2015. PLoS One. 2015. PMID: 25965583 Free PMC article.
-
Pathogenesis of ovarian cancer: clues from selected overexpressed genes.Future Oncol. 2009 Dec;5(10):1641-57. doi: 10.2217/fon.09.126. Future Oncol. 2009. PMID: 20001801 Free PMC article. Review.
References
-
- Vogelstein B. & Kinzler, K. W., (2002) The Genetic Basis of Human Cancer (McGraw–Hill, New York).
-
- Scriver C. R., Beaudet, A. L., Sly, W. S. & Valle, D., (2001) The Metabolic and Molecular Bases of Inherited Disease (McGraw–Hill, New York).
-
- Kallioniemi A., Kallioniemi, O. P., Sudar, D., Rutovitz, D., Gray, J. W., Waldman, F. & Pinkel, D. (1992) Science 258, 818-821. - PubMed
-
- Lisitsyn N., Lisitsyn, N. & Wigler, M. (1993) Science 259, 946-951. - PubMed
-
- Schrock E., du Manoir, S., Veldman, T., Schoell, B., Wienberg, J., Ferguson-Smith, M. A., Ning, Y., Ledbetter, D. H., Bar-Am, I., Soenksen, D., et al. (1996) Science 273, 494-497. - PubMed
Publication types
MeSH terms
Substances
Grants and funding
LinkOut - more resources
Full Text Sources
Other Literature Sources
Research Materials
