Tryptophan deprivation sensitizes activated T cells to apoptosis prior to cell division
- PMID: 12460190
- PMCID: PMC1782830
- DOI: 10.1046/j.1365-2567.2002.01526.x
Tryptophan deprivation sensitizes activated T cells to apoptosis prior to cell division
Abstract
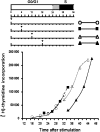
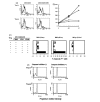
Cells expressing indoleamine 2,3-dioxygenase (IDO), an enzyme which catabolizes tryptophan, prevent T-cell proliferation in vitro, suppress maternal antifetal immunity during pregnancy and inhibit T-cell-mediated responses to tumour-associated antigens. To examine the mechanistic basis of these phenomena we activated naïve murine T cells in chemically defined tryptophan-free media. Under these conditions T cells expressed CD25 and CD69 and progressed through the first 12 hr of G0/G1 phase but did not express CD71, cyclin D3, cdk4, begin DNA synthesis, or differentiate into cytotoxic effector cells. In addition, activated T cells with their growth arrested by tryptophan deprivation exhibited enhanced tendencies to die via apoptosis when exposed to anti-Fas antibodies. Apoptosis was inhibited by caspase inhibitor and was not observed when T cells originated from Fas-deficient mice. These findings suggest that T cells activated in the absence of free tryptophan entered the cell cycle but cell cycle progression ceased in mid-G1 phase and T cells became susceptible to death via apoptosis, in part though Fas-mediated signalling. Thus, mature antigen-presenting cells expressing IDO and Fas-ligand may induce antigen-specific T-cell tolerance by blocking T-cell cycle progression and by rapid induction of T-cell activation induced cell death in local tissue microenvironments.
Figures


Similar articles
-
Inhibition of T cell proliferation by macrophage tryptophan catabolism.J Exp Med. 1999 May 3;189(9):1363-72. doi: 10.1084/jem.189.9.1363. J Exp Med. 1999. PMID: 10224276 Free PMC article.
-
Specific subsets of murine dendritic cells acquire potent T cell regulatory functions following CTLA4-mediated induction of indoleamine 2,3 dioxygenase.Int Immunol. 2004 Oct;16(10):1391-401. doi: 10.1093/intimm/dxh140. Epub 2004 Sep 6. Int Immunol. 2004. PMID: 15351783
-
Inhibition of allogeneic T cell proliferation by indoleamine 2,3-dioxygenase-expressing dendritic cells: mediation of suppression by tryptophan metabolites.J Exp Med. 2002 Aug 19;196(4):447-57. doi: 10.1084/jem.20020052. J Exp Med. 2002. PMID: 12186837 Free PMC article.
-
Extinguishing maternal immune responses during pregnancy: implications for immunosuppression.Semin Immunol. 2001 Aug;13(4):213-8. doi: 10.1006/smim.2000.0317. Semin Immunol. 2001. PMID: 11437628 Review.
-
Indoleamine 2,3-dioxygenase, immunosuppression and pregnancy.J Reprod Immunol. 2002 Oct-Nov;57(1-2):143-50. doi: 10.1016/s0165-0378(02)00040-2. J Reprod Immunol. 2002. PMID: 12385839 Review.
Cited by
-
Role of indoleamine 2, 3-dioxygenase 1 in immunosuppression of breast cancer.Cancer Pathog Ther. 2023 Nov 7;2(4):246-255. doi: 10.1016/j.cpt.2023.11.001. eCollection 2024 Oct. Cancer Pathog Ther. 2023. PMID: 39371092 Free PMC article. Review.
-
Kynurenine Pathway after Kidney Transplantation: Friend or Foe?Int J Mol Sci. 2024 Sep 14;25(18):9940. doi: 10.3390/ijms25189940. Int J Mol Sci. 2024. PMID: 39337426 Free PMC article. Review.
-
Identification of amino acids metabolomic profiling in human plasma distinguishes lupus nephritis from systemic lupus erythematosus.Amino Acids. 2024 Sep 18;56(1):56. doi: 10.1007/s00726-024-03418-1. Amino Acids. 2024. PMID: 39292313 Free PMC article.
-
Interstitial Foci Expression of Indoleamine 2,3-Dioxygenase 1: A Potential Biomarker for Kidney Transplant Rejection.J Clin Med. 2024 Jul 22;13(14):4265. doi: 10.3390/jcm13144265. J Clin Med. 2024. PMID: 39064305 Free PMC article.
-
Hypocortisolemic ASIA: a vaccine- and chronic infection-induced syndrome behind the origin of long COVID and myalgic encephalomyelitis.Front Immunol. 2024 Jul 9;15:1422940. doi: 10.3389/fimmu.2024.1422940. eCollection 2024. Front Immunol. 2024. PMID: 39044822 Free PMC article. Review.
References
-
- Fairchild PJ, Waldmann H. Dendritic cells and prospects for transplantation tolerance. Curr Opin Immunol. 2000;12:528–35. - PubMed
-
- Stockinger B. T lymphocyte tolerance: from thymic deletion to peripheral control mechanisms. Adv Immunol. 1999;71:229–65. - PubMed
-
- Banchereau J, Steinman RM. Dendritic cells and the control of immunity. Nature. 1998;392:245–52. - PubMed
-
- Li XC, Wells AD, Strom TB, Turka LA. The role of T cell apoptosis in transplantation tolerance. Curr Opin Immunol. 2000;12:522–7. - PubMed
Publication types
MeSH terms
Substances
Grants and funding
LinkOut - more resources
Full Text Sources
Other Literature Sources
Molecular Biology Databases
Research Materials
Miscellaneous

