. 2002 Dec 1;22(23):10313-23.
doi: 10.1523/JNEUROSCI.22-23-10313.2002.

Normal development of embryonic thalamocortical connectivity in the absence of evoked synaptic activity

Affiliations

Normal development of embryonic thalamocortical connectivity in the absence of evoked synaptic activity

Zoltán Molnár et al. J Neurosci. .

Abstract

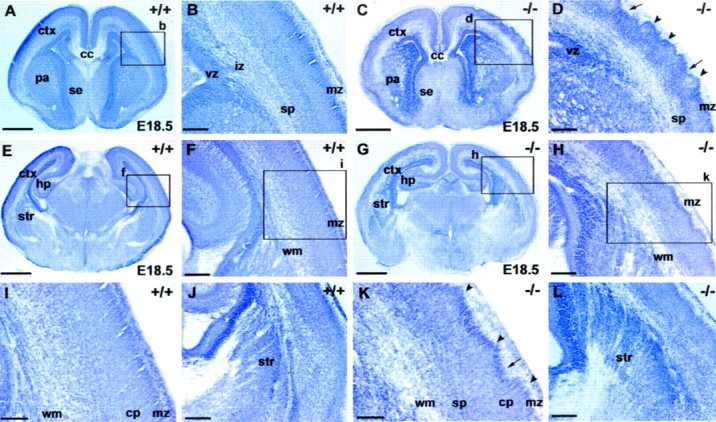
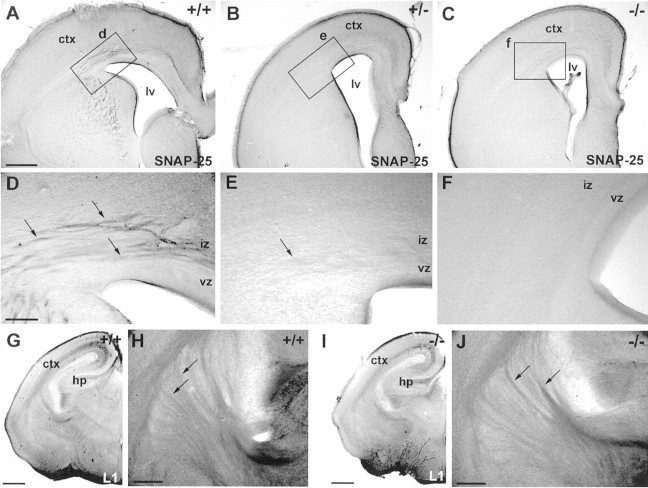
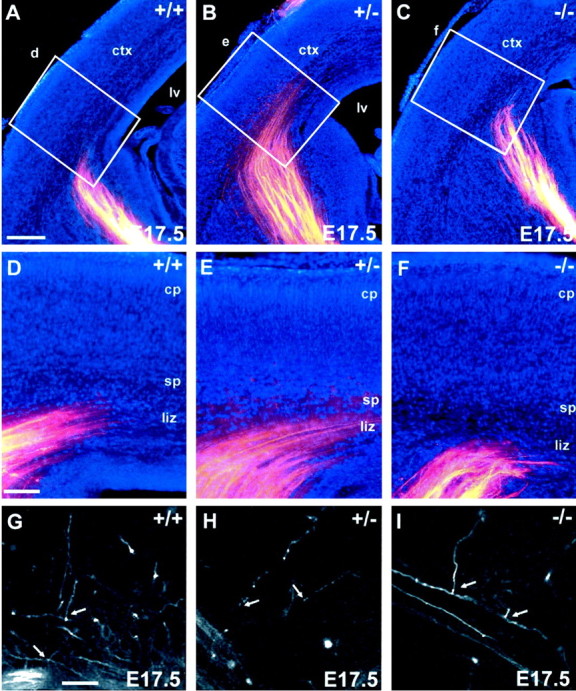
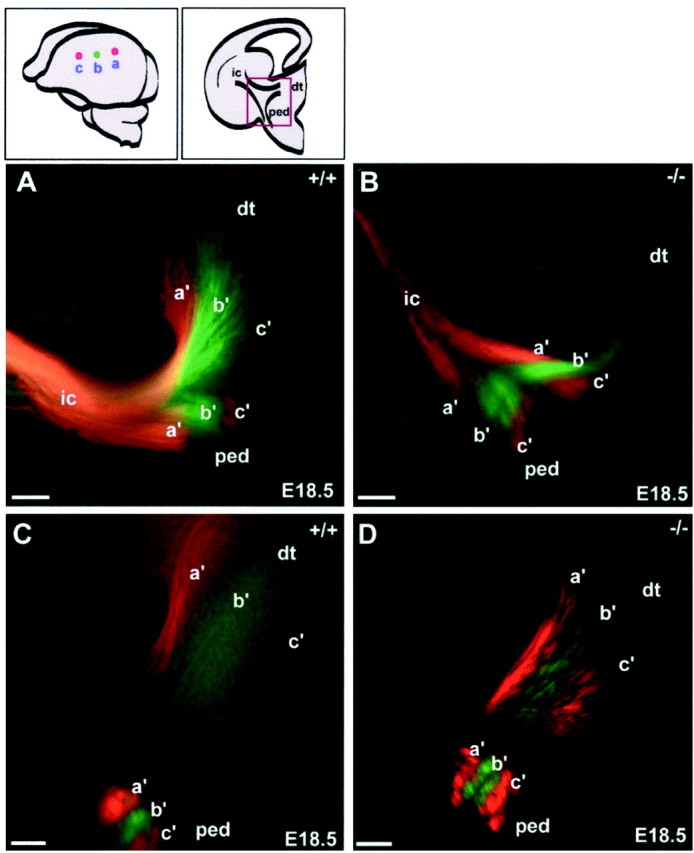
This study is concerned with the role of impulse activity and synaptic transmission in early thalamocortical development. Disruption of the gene encoding SNAP-25, a component of the soluble N-ethylmaleimide-sensitive factor attachment protein (SNAP) receptor complex required for regulated neuroexocytosis, eliminates evoked but not spontaneous neurotransmitter release (Washbourne et al., 2002). The Snap25 null mutant mouse provides an opportunity to test whether synaptic activity is required for prenatal neural development. We found that evoked release is not needed for at least the gross formation of the embryonic forebrain, because the major features of the diencephalon and telencephalon were normal in the null mutant mouse. However, half of the homozygous mutants showed undulation of the cortical plate, which in the most severely affected brains was accompanied by a marked reduction of calbindin-immunoreactive neurons. Carbocyanine dye tracing of the thalamocortical fiber pathway revealed normal growth kinetics and fasciculation patterns between embryonic days 17.5 and 19. As in normal mice, mutant thalamocortical axons reach the cortex, accumulate below the cortical plate, and then start to extend side-branches in the subplate and deep cortical plate. Multiple carbocyanine dye placements in the cortical convexity revealed normal overall topography of both early thalamocortical and corticofugal projections. Electrophysiological recordings from thalamocortical slices confirmed that thalamic axons were capable of conducting action potentials to the cortex. Thus, our data suggest that axonal growth and early topographic arrangement of these fiber pathways do not rely on activity-dependent mechanisms requiring evoked neurotransmitter release. Intercellular communication mediated by constitutive secretion of transmitters or growth factors, however, might play a part.


Figures

Fig. 1.
Fig. 1.
Nissl staining reveals grossly normal development of the telencephalon and diencephalon inSnap25 null mutant mice. Only mild abnormalities in the regularity of the cortical plate were observed in the null mutant. Coronal sections (60 μm) were cut and stained with cresyl violet to reveal major brain structures. The general morphology, cellular distribution, and lamination patterns of WT, heterozygous, and null mutant littermates were compared. A, E, Coronal sections at different rostrocaudal levels of an E18.5 WT brain (+/+). B, F, Higher-magnification views of the boxed areas labeled b andf in A and E, respectively, to demonstrate the normal lamination of the cortex (ctx) at the two levels. I, Detail of theboxed area (i) inF. J, Part of a coronal section from another E18.5 WT brain, showing the patterning of cells of the primordial corpus striatum (str) created by axon bundles of the primitive internal capsule. C, G, Coronal sections at different rostrocaudal levels in theSnap25 null mutant mouse (−/−) at E18.5.D, H, High magnification of the areasboxed in C and G, respectively. Note the abnormal lamination of the cortical plate, particularly in the upper layers and marginal zone (mz), with distinct peaks (arrowheads) and troughs (arrows) along the upper margin of layer 2.K, Detail of the box labeled kin H. Note the abnormal undulation of the upper layers of the cortical plate (arrowheads andarrows). L, View of the cellular patterning created by axonal bundles in the striatum in the null mutant, comparable with that seen in the WT (J). Scale bars: A, C, E,G, 800 μm; B, D,F, J, H, L, 200 μm; I, K, 100 μm.cp, Cortical plate; hp, hippocampus;cc, corpus callosum; se, septal eminence;pa, pallidum; vz, ventricular zone;iz, intermediate zone; sp, subplate;wm, white matter.
Fig. 2.
Fig. 2.
Expression of SNAP-25 (A–F) and L1, marker of early cortical connectivity, is revealed by immunohistochemistry in WT (+/+), HT (+/−), and KO (−/−) brains. A, SNAP-25 immunoreactivity was observed in fiber bundles extending through the corpus striatum and intermediate zone and in the upper segment of the corpus callosum in the WT. D, An enlarged view ofbox d in A. Arrowsindicate labeled fiber bundles in the intermediate zone (iz). B, E, Similar, although less intensive, labeling in the HT brain. C,F, Complete lack of immunoreactivity in these regions in KO littermates. G, H, L1 immunoreactivity is observed in the intermediate zone, striatum, and internal capsule in an E18.5 WT brain. Labeled axon fascicles crossed the striatum (arrows) and turned to the intermediate zone.I, J, No detectable differences were observed in the KO brain. ctx, Cerebral cortex;hp, hippocampus; vz, ventricular zone;iz, intermediate zone. Scale bars:AC, 200 μm;DF, 100 μm; G,I, 500 μm; H, J, 200 μm.
Fig. 3.
Fig. 3.
Expression of calretinin (CR) (AF), reelin (Reln) (GL), and calbindin (CB) (MR) revealed by immunohistochemistry in WT (+/+, left column), HT (+/−, middle column), and KO brains (−/−, right column).AC, Calretinin (CR) is expressed in some cells of the marginal zone (mz), cortical plate (cp), and hippocampus.DF, Higher-power views of theboxed regions in AC, respectively, showed no obvious differences in density of calretinin cells. Calretinin immunostaining revealed the undulations at the base of the marginal zone of the null mutant (F,arrows and arrowheads).GL, Reelin immunostain revealed equal numbers of Cajal-Retzius cells in the cortical marginal zone of the WT and KO (compare G, H withJ, K). Similar density of reelin immunoreactive cells was also detected in the hippocampal fissure (hf) of the hippocampus (compareI, L).MO, Calbindin (CB) is expressed in several different regions of the telencephalon, including cells of the striatum (str), cortex (ctx), and hippocampus (hp). The general pattern was qualitatively similar in WT (M), HT (N), and KO (O) brains. PR, Higher-power views of the boxed regions inMO showing that the density of calbindin-immunoreactive cells is substantially reduced in the KO cortex. wm, White matter; vz, ventricular zone; lv, lateral ventricle; hf, hippocampal fissure. Scale bars: AC,MO, 300 μm;DF, I, L,PR, 100 μm; G,J, 500 μm; H, K, 50 μm.
Fig. 4.
Fig. 4.
Outgrowth of thalamocortical projections revealed with DiI tracing from the dorsal thalamus in WT (A, D, G), HT (B, E, H), and KO (C, F, I) brains at E17.5. Coronal sections were photographed with two different filters to reveal the DiI label (red) and bisbenzimide counterstain (blue). AC, In all three genotypes, thalamic axons traversed the primitive internal capsule as an organized array of fiber bundles and then defasciculated and turned dorsally to run through the intermediate zone and into the subplate below the cortex (ctx). Within a single litter, individuals showed slight variation in their maturity, but there was no consistent difference among WT, HT, and Snap25 KO brains in the state of advancement of the thalamocortical fibers.DF, Higher-power views of theboxes in AC, showing the indistinguishable patterns of ingrowth of thalamic axons into the cortical plate (cp). Thalamic fibers could also be seen extending through the lower intermediate zone (liz) and into the subplate (sp) layer below the cortical plate. At this stage, axons did not substantially invade the cortical plate: the radial ingrowth of thalamocortical fibers was limited to a few side branches arising in the intermediate zone and subplate.GI, Confocal microscopic reconstructions revealed side branches of similar form and extent in all three genotypes (arrows). These small side branches of thalamic axons penetrated only the lowest part of the cortical plate. Bisbenzimide counterstaining (blue inAF) showed major anatomical features, such as the pial surface of the cortex, layer 1, and the gray matter–white matter boundaries. In this particular null mutant brain (C, F), there were no obvious undulations in the cortical plate. Scale bar:AC, 200 μm;DF, 100 μm;GI, 50 μm.
Fig. 5.
Fig. 5.
Thalamocortical projections, traced with DiI, show similar ingrowth patterns in WT (A, C,E) and KO (B, D,F) brains at E18.5. A–D, Double-exposure photomicrographs of coronal sections showing the DiI-labeled axons (red) and bisbenzimide counterstaining (blue) in the left hemisphere. Thalamic axons exhibited similar fasciculation patterns in the internal capsule (ic) and cortex (ctx) of WT (+/+) and KO (−/−) brains. In both genotypes, axons had started quite substantially to invade the cortical plate (C,D, arrows). E,F, Confocal microscopic reconstructions revealed similar patterns of invasion in the two genotypes. Thalamic projections extended up to the upper third of the cortical plate and began to show branch formation (arrows). Scale bars: A,B, 300 μm; C, D, 200 μm; E, F, 100 μm. dt, Dorsal thalamus; sp, subplate; liz, lower intermediate zone; mz, marginal zone.
Fig. 6.
Fig. 6.
Tracing with DiI and DiA from multiple cortical crystal placement sites revealed the normal topography of thalamocortical and corticofugal projections at E18.5 in both WT (A, C, D,G, I) and Snap25null mutant (B, E, F,H, J). Two crystals of DiI (red) were implanted in a parasagittal row in the cortex (ctx) of the left hemisphere of WT (A) and KO (B) brains, and one crystal of DiA (green) was placed midway between the DiI placements (shown schematically in top left). Horizontal sections were counterstained with bisbenzimide. Triple-exposure pictures were taken on a fluorescence microscope (A, B, G,H) or a confocal microscope (CF, I,J). The trajectory and distribution of the labeled fiber bundles and backlabeled thalamic cell groups were documented at different horizontal levels. A,B, Low-power images show the fiber bundles in both the cortex (top right) and the dorsal thalamus (dt) (bottom left) in horizontal sections corresponding to the red box in the schematic diagram above (rostral is to the right). Each crystal labeled a discrete group of axons (a, a′ andc, c′ labeled with DiI; b,b′ labeled with DiA). The spatial arrangement of the separate labeled bundles was maintained throughout their path, with a 90° rotation of the array between telencephalon and diencephalon.C, Higher-power confocal image, corresponding to thebox in A. D, Detailed images of the box in C, showing discrete groups of labeled thalamic cells at the tip of the axons (arrows mark individual cells). E,F, Confocal images, comparable in position and scale with C and D, respectively, from other similarly treated null mutant brains. G,H, Low-power views of more ventral sections. The bundles labeled by the different dyes stayed separate from each other, even as they passed through the constriction of the primitive internal capsule (ic). I, Higher-power confocal image of the box in G, showing fiber bundles at the level of the primitive internal capsule. J, Higher-power image of fiber bundles passing through the internal capsule from a null mutant. Scale bars: A,B, G, H, 200 μm;I, J, 100 μm; shown onC: C, E, 100 μm;D, 40 μm. hp, Hippocampus.
Fig. 7.
Fig. 7.
Topography of thalamic and corticofugal connectivity at E18.5. A parasagittal row of crystals (DiI, DiA, DiI) was implanted in the left hemisphere (schematic illustration,top left) of WT (A, C) andSnap25 KO (B, D) brains. At this age, each crystal labeled both thalamocortical axons (retrogradely) and corticofugal fibers (anterogradely).A, B, Confocal micrographs at the level of the primitive internal capsule, as indicated by the red box in the schematic coronal section above (dorsal isup). As the mixed array of corticofugal fibers enters the diencephalon (A, B,right), the descending corticofugal axons diverge from the bundle of corticothalamic and thalamocortical fibers and turn toward the cerebral peduncle (ped). Axons stained from the three crystal placements are labeled a′,b′ (DiA), and c′ (DiI). C,D, At a more caudal level, the labeled bundles entering the cerebral peduncle have separated from those entering the dorsal thalamus (dt). Scale bars:AD, 100 μm.
Fig. 8.
Fig. 8.
Electrophysiological experiments using a whole forebrain slice preparation at E18.5 (Higashi et al., 2002) revealed that thalamic axons conduct APs, but there is no obvious synaptic transmission onto neurons of the cortical plate in WT, HT, or KO brains. A, Diagram to illustrate the plane of vertical section (45° to both coronal and sagittal planes) at which brains were cut at 400 μm to produce slices containing the VB complex of the thalamus, the putative somatosensory cortex, and the entire fiber pathway in between. B, Camera lucida tracing of a thalamocortical slice preparation showing the position of the stimulating electrode in the thalamus (TH).CP, Cortical plate; SP, subplate;IZ, intermediate zone; VZ, ventricular zone; IC, internal capsule. C, Extracellular recordings after thalamic stimulation in slices from HT (+/−, left column) and KO (−/−, right column) brains. In both genotypes, stimulation of the VB produced an initial artifact (the polarity of which depended on the stimulating polarity), followed by a negative-going field potential with a peak at ∼4 msec. This peak was not eliminated by applying ionotropic blockers (40 μm CNQX, 10 μmMK801, 20 μm bicuculline) in the bath. The field potential was eliminated, however, by the subsequent application of 600 nm TTX. The responses are indistinguishable except for a difference in the form of the stimulus artifact.

Similar articles

Cited by

References

    1. Agmon A, Yang LT, O'Dowd DK, Jones EG. Organized growth of thalamocortical axons from the deep tier of terminations into layer IV of developing mouse barrel cortex. J Neurosci. 1993;13:5365–5382. - PMC - PubMed
    1. Bagri A, Martin O, Plump AS, Mak J, Pleasure SJ, Rubenstein JL, Tessier-Lavigne M. Slit proteins prevent midline crossing and determine the dorsoventral position of major axonal pathways in the mammalian forebrain. Neuron. 2002;33:233–248. - PubMed
    1. Behar TN, Smith SV, Kennedy RT, McKenzie JM, Maric I, Barker JL. GABA(B) receptors mediate motility signals for migrating embryonic cortical cells. Cereb Cortex. 2001;11:744–753. - PubMed
    1. Catalano SM, Shatz CJ. Activity-dependent cortical target selection by thalamic axons. Science. 1998;281:559–562. - PubMed
    1. Catalano SM, Robertson RT, Killackey HP. Individual axon morphology and thalamocortical topography in developing rat somatosensory cortex. J Comp Neurol. 1996;367:36–53. - PubMed

Publication types

MeSH terms

LinkOut - more resources