Characteristic genome rearrangements in experimental evolution of Saccharomyces cerevisiae
- PMID: 12446845
- PMCID: PMC138579
- DOI: 10.1073/pnas.242624799
Characteristic genome rearrangements in experimental evolution of Saccharomyces cerevisiae
Abstract
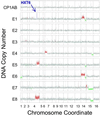
Genome rearrangements, especially amplifications and deletions, have regularly been observed as responses to sustained application of the same strong selective pressure in microbial populations growing in continuous culture. We studied eight strains of budding yeast (Saccharomyces cerevisiae) isolated after 100-500 generations of growth in glucose-limited chemostats. Changes in DNA copy number were assessed at single-gene resolution by using DNA microarray-based comparative genomic hybridization. Six of these evolved strains were aneuploid as the result of gross chromosomal rearrangements. Most of the aneuploid regions were the result of translocations, including three instances of a shared breakpoint on chromosome 14 immediately adjacent to CIT1, which encodes the citrate synthase that performs a key regulated step in the tricarboxylic acid cycle. Three strains had amplifications in a region of chromosome 4 that includes the high-affinity hexose transporters; one of these also had the aforementioned chromosome 14 break. Three strains had extensive overlapping deletions of the right arm of chromosome 15. Further analysis showed that each of these genome rearrangements was bounded by transposon-related sequences at the breakpoints. The observation of repeated, independent, but nevertheless very similar, chromosomal rearrangements in response to persistent selection of growing cells parallels the genome rearrangements that characteristically accompany tumor progression.
Figures


Similar articles
-
Genome-wide amplifications caused by chromosomal rearrangements play a major role in the adaptive evolution of natural yeast.Genetics. 2003 Dec;165(4):1745-59. doi: 10.1093/genetics/165.4.1745. Genetics. 2003. PMID: 14704163 Free PMC article.
-
Saccharomyces cerevisiae as a model system to define the chromosomal instability phenotype.Mol Cell Biol. 2005 Aug;25(16):7226-38. doi: 10.1128/MCB.25.16.7226-7238.2005. Mol Cell Biol. 2005. PMID: 16055731 Free PMC article.
-
Comparative genome hybridization on tiling microarrays to detect aneuploidies in yeast.Methods Mol Biol. 2009;548:1-18. doi: 10.1007/978-1-59745-540-4_1. Methods Mol Biol. 2009. PMID: 19521816
-
Origin, Regulation, and Fitness Effect of Chromosomal Rearrangements in the Yeast Saccharomyces cerevisiae.Int J Mol Sci. 2021 Jan 14;22(2):786. doi: 10.3390/ijms22020786. Int J Mol Sci. 2021. PMID: 33466757 Free PMC article. Review.
-
Advances in molecular methods to alter chromosomes and genome in the yeast Saccharomyces cerevisiae.Appl Microbiol Biotechnol. 2009 Oct;84(6):1045-52. doi: 10.1007/s00253-009-2144-z. Epub 2009 Aug 15. Appl Microbiol Biotechnol. 2009. PMID: 19685240 Review.
Cited by
-
Template switching during DNA replication is a prevalent source of adaptive gene amplification.bioRxiv [Preprint]. 2024 Oct 15:2024.05.03.589936. doi: 10.1101/2024.05.03.589936. bioRxiv. 2024. Update in: Elife. 2025 Feb 03;13:RP98934. doi: 10.7554/eLife.98934. PMID: 39464144 Free PMC article. Updated. Preprint.
-
Cell periphery-related proteins as major genomic targets behind the adaptive evolution of an industrial Saccharomyces cerevisiae strain to combined heat and hydrolysate stress.BMC Genomics. 2015 Jul 9;16(1):514. doi: 10.1186/s12864-015-1737-4. BMC Genomics. 2015. PMID: 26156140 Free PMC article.
-
Annelid Comparative Genomics and the Evolution of Massive Lineage-Specific Genome Rearrangement in Bilaterians.Mol Biol Evol. 2024 Sep 4;41(9):msae172. doi: 10.1093/molbev/msae172. Mol Biol Evol. 2024. PMID: 39141777 Free PMC article.
-
Heterozygote Advantage Is a Common Outcome of Adaptation in Saccharomyces cerevisiae.Genetics. 2016 Jul;203(3):1401-13. doi: 10.1534/genetics.115.185165. Epub 2016 May 18. Genetics. 2016. PMID: 27194750 Free PMC article.
-
The Ty1 LTR-retrotransposon of budding yeast, Saccharomyces cerevisiae.Microbiol Spectr. 2015 Apr 1;3(2):1-35. doi: 10.1128/microbiolspec.MDNA3-0053-2014. Microbiol Spectr. 2015. PMID: 25893143 Free PMC article.
References
Publication types
MeSH terms
Substances
Grants and funding
LinkOut - more resources
Full Text Sources
Other Literature Sources
Molecular Biology Databases

