. 2002 Nov 25;159(4):649-61.
doi: 10.1083/jcb.200205098. Epub 2002 Nov 18.

Neural cell adhesion molecule promotes accumulation of TGN organelles at sites of neuron-to-neuron contacts

Affiliations

Neural cell adhesion molecule promotes accumulation of TGN organelles at sites of neuron-to-neuron contacts

Vladimir Sytnyk et al. J Cell Biol. .

Abstract

Transformation of a contact between axon and dendrite into a synapse is accompanied by accumulation of the synaptic machinery at this site, being delivered in intracellular organelles mainly of TGN origin. Here, we report that in cultured hippocampal neurons, TGN organelles are linked via spectrin to clusters of the neural cell adhesion molecule (NCAM) in the plasma membrane. These complexes are translocated along neurites and trapped at sites of initial neurite-to-neurite contacts within several minutes after initial contact formation. The accumulation of TGN organelles at contacts with NCAM-deficient neurons is reduced when compared with wild-type cells, suggesting that NCAM mediates the anchoring of intracellular organelles in nascent synapses.


Figures
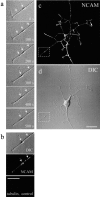
Figure 1.
Figure 1.
NCAM clusters are colocalized with intracellular organelles moving along neurites. (a) Time-lapse video recording of intracellular organelle movement along a neurite of a hippocampal neuron maintained for 2 d in culture. Organelles (arrows), seen on the image as dark granules or varicosities, undergo intermittent movement along neurites. Time points are indicated in the lower right corners of the images. (b) At the end of the video recording, the culture was fixed and stained with polyclonal NCAM antibodies (NCAM). Clusters of NCAM overlap with organelles that were moving during the video recording (arrows, see the corresponding DIC image). Antibodies against tubulin, applied together with NCAM antibodies to control membrane integrity, do not show any staining (tubulin, control). (c and d) Indirect immunofluorescence for NCAM and the corresponding DIC image of the neuron taken for video recording. Brackets show the area taken for the recording. Bars: (b) 10 μm (for a and b); (d) 20 μm (for c and d).
Figure 2.
Figure 2.
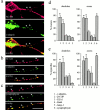
NCAM clusters are associated with TGN organelles. (a–c) Double immunofluorescence staining of the hippocampal neurons maintained for 4 d in vitro using antibodies against NCAM, γ-adaptin (a and b), and synaptophysin (c). Neurites considered as dendrites (a) or axons (b and c) are shown. Clusters of NCAM coincide with γ-adaptin– positive organelles and synaptophysin accumulations (arrows). Bar, 10 μm. (d and e) Mean percentage of NCAM clusters that overlap with organelles labeled with antibodies against γ-adaptin, β-COP, EEA1, Rab4, lamp-1, and synaptophysin (d) and mean percentage of organelles labeled with antibodies against γ-adaptin, β-COP, EEA1, Rab4, lamp-1, and synaptophysin that overlap with NCAM clusters (e). Data present mean ± SEM (n > 20 neurons, >200 organelles). *P < 0.01, unpaired t test shows a significant difference between the percentage of NCAM clusters overlapping with γ-adaptin–, β-COP–, and synaptophysin-positive organelles and a significant difference between the percentage of γ-adaptin–, β-COP–, and synaptophysin-positive organelles overlapping with NCAM clusters compared with other markers.
Figure 3.
Figure 3.
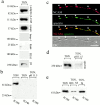
NCAM180 interacts with TGN membranes via spectrin. (a) Isolated TGN membranes (TGN) are positive for γ-adaptin, β-COP, and synaptophysin, and negative for lamp-1, Rab4, and EEA1. They also contain βI spectrin labeled with βI-specific antibodies. (b) TGN membranes isolated from the brains of NCAM-deficient mice were incubated with intracellular domains of NCAM140 (IC140) and NCAM180 (IC180), washed, and assayed for IC140 and IC180 binding by immunoblotting with antibodies to NCAM. Immunoblots show that only IC180 interacts with TGN membranes (TGN, IC180), whereas IC140 does not show any binding and precipitation (TGN, IC140). IC180 does not precipitate with TGN membranes extracted at pH 11.5 (TGN, pH 11.5, IC180). (c) Clusters of NCAM overlap with spectrin accumulations (arrows). Hippocampal neurons were maintained for 3 d in vitro. Bar, 10 μm. (d) Spectrin is removed from TGN membranes by extraction at pH 11.5. (e) TGN membranes isolated from the brains of NCAM-deficient mice were incubated with polyclonal antibodies to spectrin and nonimmune immunoglobulins. Then, untreated and treated TGN membranes were assayed for IC180 binding. Immunoblots show that spectrin polyclonal antibodies significantly reduce binding of IC180 (TGN, spec. Ab, IC180), when compared with untreated TGN membranes (TGN, IC180) or TGN membranes incubated with nonimmune immunoglobulins (TGN, Ig, IC180).
Figure 4.
Figure 4.
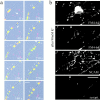
Movement of NCAM- immunoreactive clusters associated with TGN organelles. (a) Time-lapse video recording of the movements of NCAM-immunoreactive clusters and associated intracellular organelles along neurites of a hippocampal neuron maintained for 3 d in culture. The neuron was stained by indirect immunofluorescence using monoclonal NCAM antibody (H28, green) applied to live cultures. FM4-64 (red) applied to the culture 24 h before application of the antibody was used to label organelles. NCAM-immunoreactive clusters (marked by 1–8) overlap with intracellular organelles loaded with FM4-64, with the yellow color indicating coincident immunofluorescence signals. Organelles are also seen as dark granules on the corresponding DIC image. Clusters associated with the organelles move along neurites intermittently and bidirectionally. See also Video 1 (available at http://www.jcb.org/cgi/content/full/jcb.200205098/DC1). (b) At the end of the video recording, the culture was fixed and stained with NCAM polyclonal antibodies. All clusters revealed by monoclonal NCAM immunostaining (H28) were stained with NCAM polyclonal antibodies (NCAM pAb). Antibodies to tubulin applied together with NCAM polyclonal antibodies to nonpermeabilized culture to monitor membrane integrity do not show any staining. Bar, 10 μm (for a and b). (c) A hippocampal neuron maintained for 3 d in culture was stained with antibodies against NCAM and γ-adaptin. The FM4-64 dye applied to the culture 24 h before application of the antibody was used to label organelles. FM4-64–labeled organelles (arrows) overlap with NCAM clusters and are γ-adaptin positive. γ-Adaptin–positive organelles not labeled with FM4-64 are also seen (triangle). Bar, 10 μm. (d) Mean percentage of mobile FM4-64– or RITC-dextran– labeled organelles associated with NCAM clusters. (e) Mean percentage of mobile NCAM clusters associated with FM4-64– or RITC-dextran– labeled organelles. Data present mean ± SEM (n > 15 neurons, >300 organelles, >500 NCAM clusters).
Figure 5.
Figure 5.
Accumulation of NCAM-immunoreactive clusters and associated organelles at the contact site between two neurites. Hippocampal neurons maintained for 3 d in culture were stained with monoclonal NCAM antibodies (red). Intracellular organelles were loaded with FM1-43, applied for 24 h before the start of recording (green). Immediately at the start of recording, the growth cones of the neurite extending from the lower right hand corner (arrow) have not reached the neighboring target neurite. NCAM-immunoreactive clusters associated with intracellular organelles marked with FM1-43 and seen in yellow (marked by 1–4) move along the target neurite. During recording three contacts were formed. At the end of the recording, each contact was associated with an NCAM-immunoreactive cluster and intracellular organelles on the target neurite. Bar, 10 μm. See also Video 3 (available at http://www.jcb.org/cgi/content/full/jcb.200205098/DC1). (b) Hippocampal neuron maintained for 4 d in culture was stimulated with a solution containing 90 mM K+. Intracellular organelles were loaded with FM4-64, applied for 24 h before stimulation. Stimulation induced destaining of FM4-64–labeled organelles (arrows). The neuron was fixed and stained with antibodies against NCAM and synaptophysin. The staining shows that FM4-64–labeled organelles coincide with NCAM clusters. Most of the organelles were synaptophysin immunonegative. Triangle arrow points to the organelle that was colocalized with synaptophysin accumulation. Bar, 20 μm.
Figure 6.
Figure 6.
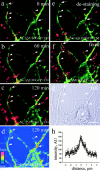
Sites of NCAM180–GFP accumulation become functional contacts. NCAM180–GFP-transfected neurons were maintained for 5 d in culture. (a–c) Synapses were stained three times with a 1-h interval between a, b, and c by acute application of FM4-64 (red) in a solution containing 90 mM K+. Within 2 h, several new sites undergoing depolarization-induced endocytosis of FM4-64 were found (arrows). Pseudocolored picture of NCAM180–GFP (red and yellow colors correspond to the higher density of NCAM180–GFP) shows that synaptic differentiation occurs at sites of NCAM180–GFP accumulation (d). Pre-existing functional contacts (arrowheads) also colocalize with NCAM180–GFP accumulations. Synapses were destained by application of the medium containing 90 mM K+ without FM4-64 (e). The staining with antibodies against synaptophysin confirmed that FM4-64–stained synaptic boutons coincided with synaptophysin accumulations (f). (g) Corresponding DIC image. (h) Average profile of NCAM180–GFP distribution along neurites in the vicinity of contact sites. Zero coordinate (distance axis) corresponds to the point apposed to acutely FM4-64–loaded boutons. Bar, 10 μm.
Figure 7.
Figure 7.
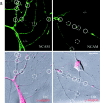
Accumulation of TGN organelles at sites of contact on NCAM-positive cells. (a) Immunofluorescence staining for NCAM and γ-adaptin of hippocampal neurons from wild-type (+/+) and NCAM-deficient (−/−) mice maintained in coculture for 4 d. Multiple γ-adaptin–positive organelles (red) distributed along neurites are seen (see overlay of DIC image and γ-adaptin staining). NCAM+/+ neurites were identified by NCAM staining. Contacts identified in the DIC image were classified as γ-adaptin positive (circles, solid lines) or γ-adaptin negative (circles, dashed line). (b) A histogram showing the number of γ-adaptin–positive contacts formed by NCAM−/− axons on NCAM−/− dendrites, NCAM+/+ axons on NCAM−/− dendrites, NCAM−/− axons on NCAM+/+ dendrites, and NCAM+/+ axons on NCAM+/+ dendrites as percentage of the total number of all contacts analyzed. Data present mean ± SEM (six cultures, two independent experiments). *P < 0.01, paired t test shows a significant difference in the percentage of γ-adaptin–positive contacts between NCAM-negative and other types of contacts. Bar, 10 μm.
Figure 7.
Figure 7.
Accumulation of TGN organelles at sites of contact on NCAM-positive cells. (a) Immunofluorescence staining for NCAM and γ-adaptin of hippocampal neurons from wild-type (+/+) and NCAM-deficient (−/−) mice maintained in coculture for 4 d. Multiple γ-adaptin–positive organelles (red) distributed along neurites are seen (see overlay of DIC image and γ-adaptin staining). NCAM+/+ neurites were identified by NCAM staining. Contacts identified in the DIC image were classified as γ-adaptin positive (circles, solid lines) or γ-adaptin negative (circles, dashed line). (b) A histogram showing the number of γ-adaptin–positive contacts formed by NCAM−/− axons on NCAM−/− dendrites, NCAM+/+ axons on NCAM−/− dendrites, NCAM−/− axons on NCAM+/+ dendrites, and NCAM+/+ axons on NCAM+/+ dendrites as percentage of the total number of all contacts analyzed. Data present mean ± SEM (six cultures, two independent experiments). *P < 0.01, paired t test shows a significant difference in the percentage of γ-adaptin–positive contacts between NCAM-negative and other types of contacts. Bar, 10 μm.
Figure 8.
Figure 8.
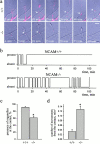
NCAM stabilizes TGN organelles at sites of contact. (a) Contact formation between NCAM+/+ and NCAM−/− neurons. TGN organelles were labeled with FM4-64 applied for 24 h (“prolonged” protocol). Organelles were trapped at the contact between NCAM+/+ neurons 20 min after contact formation and remained associated with the contact for 100 min until the end of recordings. Organelles were not trapped at the contact between NCAM−/− neurons, appearing only transiently at the site of contact (see 10 min) (arrows). The contacting neurite was retracted 30 min after contact formation. Bar, 5 μm. (b) Representative diagrams showing the dynamics of TGN organelle accumulation at the site of contact recorded in NCAM+/+ and NCAM−/− cultures. Note the continuous presence of organelles at contacts between NCAM+/+ neurons (trapping event). (c) Histogram showing the mean time that a contact contained organelles as a percentage of the total recording time (set to 100%). (d) Histogram showing the mean number of events when organelles moved away from the contact. *P < 0.001, t test shows a significant difference between NCAM- deficient and wild-type neurons.
Figure 9.
Figure 9.
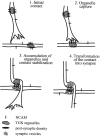
A model of NCAM-mediated accumulation of TGN organelles at sites of contact followed by synaptic differentiation.

Similar articles

Cited by

References

    1. Ahmari, S.E., J. Buchanan, and S.J. Smith. 2000. Assembly of presynaptic active zones from cytoplasmic transport packets. Nat. Neurosci. 3:445–451. - PubMed
    1. Burry, R.W. 1986. Presynaptic elements on artificial surfaces. A model for the study of development and regeneration of synapses. Neurochem. Pathol. 5:345–360. - PubMed
    1. Burry, R.W. 1991. Transitional elements with characteristics of both growth cones and presynaptic terminals observed in cell cultures of cerebellar neurons. J. Neurocytol. 20:124–132. - PubMed
    1. Clague, M.J. 1998. Molecular aspects of the endocytic pathway. Biochem. J. 336:271–282. - PMC - PubMed
    1. Cremer, H., R. Lange, A. Christoph, M. Plomann, G. Vopper, J. Roes, R. Brown, S. Baldwin, P. Kraemer, S. Scheff, et al. 1994. Inactivation of the N-CAM gene in mice results in size reduction of the olfactory bulb and deficits in spatial learning. Nature. 367:455–459. - PubMed

Publication types

MeSH terms