

Gene expression analysis using oligonucleotide arrays produced by maskless photolithography
- PMID: 12421762
- PMCID: PMC187555
- DOI: 10.1101/gr.362402
Gene expression analysis using oligonucleotide arrays produced by maskless photolithography
Abstract
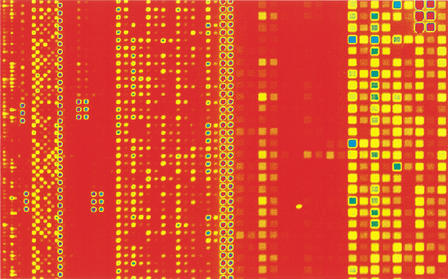
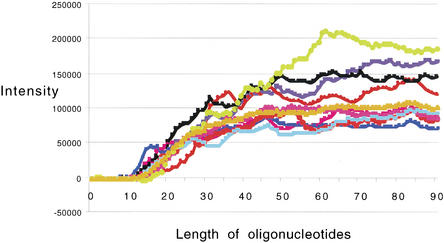
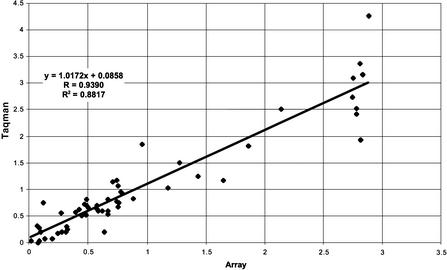
Microarrays containing 195,000 in situ synthesized oligonucleotide features have been created using a benchtop, maskless photolithographic instrument. This instrument, the Maskless Array Synthesizer (MAS), uses a digital light processor (DLP) developed by Texas Instruments. The DLP creates the patterns of UV light used in the light-directed synthesis of oligonucleotides. This digital mask eliminates the need for expensive and time-consuming chromium masks. In this report, we describe experiments in which we tested this maskless technology for DNA synthesis on glass surfaces. Parameters examined included deprotection rates, repetitive yields, and oligonucleotide length. Custom gene expression arrays were manufactured and hybridized to Drosophila melanogaster and mouse samples. Quantitative PCR was used to validate the gene expression data from the mouse arrays.
Figures


Similar articles
-
Application of four dyes in gene expression analyses by microarrays.BMC Genomics. 2005 Jul 25;6:101. doi: 10.1186/1471-2164-6-101. BMC Genomics. 2005. PMID: 16042794 Free PMC article.
-
Maskless fabrication of light-directed oligonucleotide microarrays using a digital micromirror array.Nat Biotechnol. 1999 Oct;17(10):974-8. doi: 10.1038/13664. Nat Biotechnol. 1999. PMID: 10504697
-
Striptease on glass: validation of an improved stripping procedure for in situ microarrays.J Biotechnol. 2007 Jan 30;128(1):1-13. doi: 10.1016/j.jbiotec.2006.09.003. Epub 2006 Sep 16. J Biotechnol. 2007. PMID: 17084936
-
Drosophila microarray platforms.Brief Funct Genomic Proteomic. 2003 Jul;2(2):97-105. doi: 10.1093/bfgp/2.2.97. Brief Funct Genomic Proteomic. 2003. PMID: 15239930 Review.
-
Improving reliability and performance of DNA microarrays.Expert Rev Mol Diagn. 2006 May;6(3):481-92. doi: 10.1586/14737159.6.3.481. Expert Rev Mol Diagn. 2006. PMID: 16706748 Review.
Cited by
-
A general framework for designing and validating oligomer-based DNA microarrays and its application to Clostridium acetobutylicum.Appl Environ Microbiol. 2007 Jul;73(14):4631-8. doi: 10.1128/AEM.00144-07. Epub 2007 May 25. Appl Environ Microbiol. 2007. PMID: 17526797 Free PMC article.
-
Prognostic gene expression signatures can be measured in tissues collected in RNAlater preservative.J Mol Diagn. 2006 Feb;8(1):31-9. doi: 10.2353/jmoldx.2006.050056. J Mol Diagn. 2006. PMID: 16436632 Free PMC article.
-
Correlation of mRNA expression and protein abundance affected by multiple sequence features related to translational efficiency in Desulfovibrio vulgaris: a quantitative analysis.Genetics. 2006 Dec;174(4):2229-43. doi: 10.1534/genetics.106.065862. Epub 2006 Oct 8. Genetics. 2006. PMID: 17028312 Free PMC article.
-
DNA microarray analysis of anaerobic Methanosarcina barkeri reveals responses to heat shock and air exposure.J Ind Microbiol Biotechnol. 2006 Sep;33(9):784-90. doi: 10.1007/s10295-006-0114-3. Epub 2006 Apr 8. J Ind Microbiol Biotechnol. 2006. PMID: 16604357
-
High-Efficiency Reverse (5'→3') Synthesis of Complex DNA Microarrays.Sci Rep. 2018 Oct 10;8(1):15099. doi: 10.1038/s41598-018-33311-3. Sci Rep. 2018. PMID: 30305718 Free PMC article.
References
-
- Dill K, Stanker LH, Young CR. Detection of salmonella in poultry using a silicon chip-based biosensor. J Biochem Biophys Meth. 1999;41:61–67. - PubMed
-
- Fodor SPA, Read JL, Pirrung MC, Stryer L, Lu AT, Solas D. Light-directed, spatially addressable parallel chemical synthesis. Science. 1991;251:767–773. - PubMed
-
- Hasan A, Stengele KP, Giegrich H, Cornwell P, Isham KR, Sachleben RA, Pfleiderer W, Foote RS. Photolabile protecting groups for nucleosides: Synthesis and photodeprotection rates. Tetrahedron. 1997;53:4247–4264.
-
- Hughes TR, Mao M, Jones AR, Burchard J, Marton MJ, Shannon KW, Lefkowitz SM, Ziman S, Schleter JM, Meyer MR, et al. Expression profiling using microarrays fabricated by an ink-jet oligonucleotide synthesizer. Nat Biotech. 2001;19:342–347. - PubMed
-
- McGall GH, Barone AD, Diggelmann M, Fodor SPA, Gentalen E, Ngo N. The efficiency of light-directed synthesis of DNA arrays on glass substrates J. Am Chem Soc. 1997;119:5081–5090.
MeSH terms
Substances
LinkOut - more resources
Full Text Sources
Other Literature Sources
Molecular Biology Databases