. 2002 Dec;22(23):8101-13.
doi: 10.1128/MCB.22.23.8101-8113.2002.

Transduction of growth or mitogenic signals into translational activation of TOP mRNAs is fully reliant on the phosphatidylinositol 3-kinase-mediated pathway but requires neither S6K1 nor rpS6 phosphorylation

Affiliations

Transduction of growth or mitogenic signals into translational activation of TOP mRNAs is fully reliant on the phosphatidylinositol 3-kinase-mediated pathway but requires neither S6K1 nor rpS6 phosphorylation

Miri Stolovich et al. Mol Cell Biol. 2002 Dec.

Abstract

Translation of terminal oligopyrimidine tract (TOP) mRNAs, which encode multiple components of the protein synthesis machinery, is known to be controlled by mitogenic stimuli. We now show that the ability of cells to progress through the cell cycle is not a prerequisite for this mode of regulation. TOP mRNAs can be translationally activated when PC12 or embryonic stem (ES) cells are induced to grow (increase their size) by nerve growth factor and retinoic acid, respectively, while remaining mitotically arrested. However, both growth and mitogenic signals converge via the phosphatidylinositol 3-kinase (PI3-kinase)-mediated pathway and are transduced to efficiently translate TOP mRNAs. Translational activation of TOP mRNAs can be abolished by LY294002, a PI3-kinase inhibitor, or by overexpression of PTEN as well as by dominant-negative mutants of PI3-kinase or its effectors, PDK1 and protein kinase Balpha (PKBalpha). Likewise, overexpression of constitutively active PI3-kinase or PKBalpha can relieve the translational repression of TOP mRNAs in quiescent cells. Both mitogenic and growth signals lead to phosphorylation of ribosomal protein S6 (rpS6), which precedes the translational activation of TOP mRNAs. Nevertheless, neither rpS6 phosphorylation nor its kinase, S6K1, is essential for the translational response of these mRNAs. Thus, TOP mRNAs can be translationally activated by growth or mitogenic stimuli of ES cells, whose rpS6 is constitutively unphosphorylated due to the disruption of both alleles of S6K1. Similarly, complete inhibition of mammalian target of rapamycin (mTOR) and its effector S6K by rapamycin in various cell lines has only a mild repressive effect on the translation of TOP mRNAs. It therefore appears that translation of TOP mRNAs is primarily regulated by growth and mitogenic cues through the PI3-kinase pathway, with a minor role, if any, for the mTOR pathway.


Figures
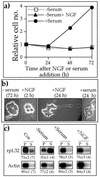
FIG. 1.
FIG. 1.
NGF induces translational activation of TOP mRNAs in nondividing PC12 cells. (a) PC12 cells were serum starved for 72 h (zero time) and then either serum refed (+Serum) or further serum starved without (−Serum) or with 25 nM NGF (−Serum + NGF). At the indicated times, cells were trypsinized and counted. Numbers of cells (average of at least two repetitions for each time point) were normalized to the number at time zero. (b) PC12 cells were serum starved for 72 h (−serum) and then either serum refed (+serum) or treated with 25 nM NGF (+NGF). At the indicated times, cells were microscopically visualized at the same magnification. (c) Untreated (Con), 72-h serum-starved (−Serum), 72-h serum-starved and then 0.5-h serum-refed (+Serum), and NGF (25 nM)-treated (+NGF) PC12 cells were harvested, and cytoplasmic extracts were prepared. These extracts were centrifuged through sucrose gradients and separated into polysomal (P) and subpolysomal (S) fractions. RNA from equivalent aliquots of these fractions was analyzed by Northern blot hybridization with cDNAs for actin and rpL32. The radioactive signals were quantified by phosphorimager, and the relative translational efficiency of each mRNA is presented numerically beneath the autoradiograms as a percentage of the mRNA engaged in polysomes. These values are expressed as the average ± standard error of the mean, with the number of determinations shown in parentheses, or as the average, with the individual values in parentheses, if only two determinations were available.
FIG. 2.
FIG. 2.
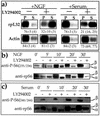
LY294002 inhibits the phosphorylation of rpS6 as well as the translational activation of TOP mRNAs upon growth or mitogenic stimulation. (a) PC12 cells were serum starved for 72 h and then either treated with 50 ng of NGF per ml (+NGF) or serum refed (+Serum) for 30 min without (−) or with (+) 50 μM LY294002. Subsequently, cells were harvested and subjected to polysomal analysis, as described in the legend to Fig. 1. (b and c) PC12 cells were serum starved for 72 h (0 min) and then either treated with 50 ng of NGF per ml (b) or serum refed (c) without (−) or with (+) 50 μM LY294002 for the indicated times. The cytoplasmic proteins were subjected to Western blot analysis with the indicated antibodies. α and β represent hypophosphorylated and hyperphosphorylated forms of rpS6, respectively.
FIG. 3.
FIG. 3.
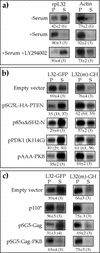
PI3-kinase-dependent pathway mediates mitogenic signals into translational efficiency of TOP mRNAs. (a) 293 cells were serum starved for 26 h (−Serum) or serum refed for 3 h (+Serum) without or with 50 μM LY294002, after which the cells were harvested. The polysomal distribution of mRNAs encoding rpL32 and actin was analyzed and presented as described in the legend to Fig. 1. (b and c) 293 cells were triply cotransfected with 2 μg of vectors encoding L32-GFP and L32(−1C->A)-GH and 16 μg of an empty vector (pSG5) or an expression vector, as indicated at the left. Then, 24 h later, cells were serum starved for 26 h and refed for 3 h (b) or serum starved for 26 h without refeeding (c). The polysomal distribution of L32-GFP and L32(21C−>A)-GH mRNAs was analyzed and presented as described in the legend to Fig. 1.
FIG. 4.
FIG. 4.
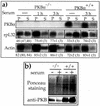
Translation of TOP mRNAs is normally regulated in PKBα−/− MEF cells. (a) PKBα+/+ and PKBα−/− MEF were harvested after being serum starved for 44 h without or with 1 or 3 h of serum refeeding. The polysomal distribution of the mRNAs encoding PKBα, rpL32, and actin was analyzed and presented as described in the legend to Fig. 1. (b) Cytoplasmic proteins from PKBα+/+ (+/+) and PKBα−/− (−/−) MEF were harvested after being serum starved for 44 h without (−) or with 1 h of serum refeeding (+) and subjected to Western blot analysis. Bottom panel, immunoblotting with anti-PKB. Top panel, Ponceau S-stained membrane, showing the relative protein loading among samples. Note that the three PKB isoforms contain similar numbers of amino acids (from 466 to 481 residues).
FIG. 5.
FIG. 5.
Phosphorylation of rpS6 is not sufficient to enable efficient translation of TOP mRNAs. (a) Cytoplasmic extracts were prepared from four proliferating lymphoblastoid cell lines (WHI1660, WHI1249, WHI1615, and WHI1860) or from P1798 cells which were either dividing (Con or C) or nondividing due to 24 h of dexamethasone treatment (Dex or D). The polysomal distribution of the mRNAs encoding rpL32 and actin was analyzed and presented as described in the legend to Fig. 1. (b and c) Cytoplasmic proteins from the cells mentioned in panel a were subjected to Western blot analysis with the indicated antibodies.
FIG. 6.
FIG. 6.
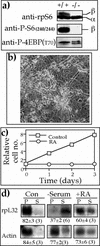
Retinoic acid induces translational activation of TOP mRNAs in growing but not dividing p70S6K−/− ES cells. (a) Cytoplasmic proteins from wild-type ES cells (+/+) and p70S6K−/− cells (−/−) were subjected to Western blot analysis with the indicated antibodies. (b) p70S6K−/− ES cells were induced to neuronal differentiation (with retinoic acid), as described in Materials and Methods and visualized microscopically. (c) p70S6K−/− ES cells were either untreated (Con) or induced to neuronal differentiation with retinoic acid (RA), as described in Materials and Methods. Proliferation was monitored by measuring the A650 of the methylene blue dye extracted from stained cells. The absorbance measured 24 h after plating was arbitrarily set at 1, and absorbance measured at later time points (average of at least two repetitions for each time point) was normalized to that value. (d) p70S6K−/− cells were untreated (Con), serum starved for 40 h (−Serum), or induced to neuronal differentiation with retinoic acid (+RA). The polysomal distribution of the mRNAs encoding rpL32 and actin was analyzed and presented as described in the legend to Fig. 1.
FIG. 7.
FIG. 7.
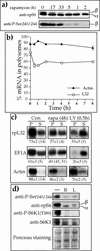
Rapamycin has a minor and delayed inhibitory effect on the translation of TOP mRNAs. (a, b, and c) PC12 cells were serum starved for 72 h (0 min) and then either treated with 50 ng of NGF per ml (a and c) or serum refed (b and c) without (−) or with (+) 20 nM rapamycin for the indicated times (a and b) or for 30 min (c), after which the cells were harvested. The cytoplasmic proteins were subjected to Western blot analysis with the indicated antibodies. The bottom panel in c is the Ponceau S-stained membrane, showing the relative protein loading among samples. (d) PC12 cells were serum starved for 72 h and then either treated with 50 ng of NGF per ml or serum refed without (−) or with (+) 20 nM rapamycin for 60 min, after which they were harvested. The polysomal distribution of the mRNAs encoding rpL32 and actin was analyzed and presented as described in the legend to Fig. 1. (e) p70S6K−/− ES cells were serum starved for 40 h and then refed in the absence (−) or presence (+) of 20 nM rapamycin for the indicated times. Cytoplasmic proteins were subjected to Western blot analysis with the indicated antibodies. (f) p70S6K−/− ES cells were serum starved for 40 h and then refed for 3 h in the absence (−) or presence (+) of 20 nM rapamycin. The polysomal distribution of the mRNAs encoding rpL32, eEF1A, and actin was analyzed as described in the legend to Fig. 1. The results in panels d and f are expressed as the average ± standard error of the mean, with the number of determinations in parentheses, or as the average, with the individual values in parentheses, if only two determinations were available.
FIG. 8.
FIG. 8.
Prolonged rapamycin treatment only mildly represses the translation of TOP mRNAs. (a and d) Proliferating 293 cells were treated with 20 nM rapamycin for the indicated time (a) or for 1 h (lane R in d) or with 50 mM LY294002 for 30 min (lane L in d), after which the cells were harvested. The cytoplasmic proteins were subjected to Western blot analysis with the indicated antibodies. The bottom panel in d is the Ponceau S-stained membrane, showing the relative protein loading among samples. (b and c) Proliferating 293 cells were treated with 20 nM rapamycin for the indicated times (b) or for 4 h (c) or with 50 mM LY294002 for 30 min. The polysomal distribution of rpL32, eEF1A, and actin mRNAs was analyzed as described in the legend to Fig. 1. The relative amount of the mRNAs in polysomes is presented graphically in b and numerically in c.
FIG. 9.
FIG. 9.
Schematic representation of signal transduction pathways involved in activation of rpS6 phosphorylation and translational control of TOP mRNAs in serum- and amino acid-stimulated cells. Arrows delineate the flow of information. The open arrowhead represents the minor effect of rapamycin on TOP mRNA translation. The site of convergence of this effect with that of other signals is purely speculative. Circled and boxed question marks represent putative links and unknown targets, respectively. See text for details.

Similar articles

Cited by

References

    1. Aloni, R., D. Peleg, and O. Meyuhas. 1992. Selective translational control and nonspecific posttranscriptional regulation of ribosomal protein gene expression during development and regeneration of rat liver. Mol. Cell. Biol. 12:2203-2212. - PMC - PubMed
    1. Antoniades, H., and A. Owen. 1982. Growth factors and regulation of cell growth. Annu. Rev. Med. 33:445-463. - PubMed
    1. Avni, D., Y. Biberman, and O. Meyuhas. 1997. The 5′ terminal oligopyrimidine tract confers translational control on TOP mRNAs in a cell type-and sequence context-dependent manner. Nucleic Acids Res. 25:995-1001. - PMC - PubMed
    1. Avni, D., S. Shama, F. Loreni, and O. Meyuhas. 1994. Vertebrate mRNAs with a 5′-terminal pyrimidine tract are candidates for translational repression in quiescent cells: characterization of the translational cis-regulatory element. Mol. Cell. Biol. 14:3822-3833. - PMC - PubMed
    1. Bain, G., D. Kitchens, M. Yao, J. Huettner, and D. Gottlieb. 1995. Embryonic stem cells express neuronal properties in vitro. Dev. Biol. 168:342-357. - PubMed

Publication types

MeSH terms