

Virus replication and cytokine production in dengue virus-infected human B lymphocytes
- PMID: 12414963
- PMCID: PMC136880
- DOI: 10.1128/jvi.76.23.12242-12249.2002
Virus replication and cytokine production in dengue virus-infected human B lymphocytes
Abstract
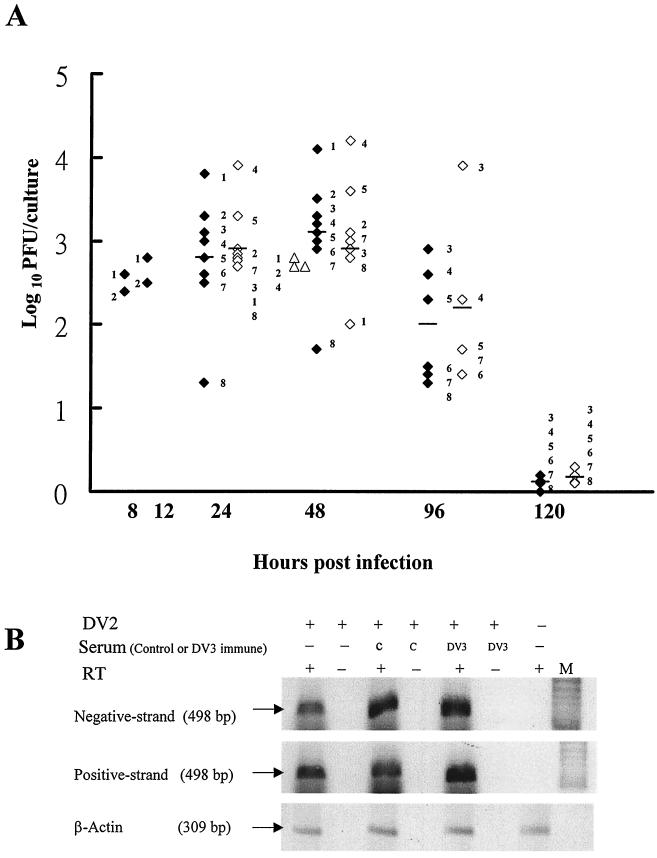
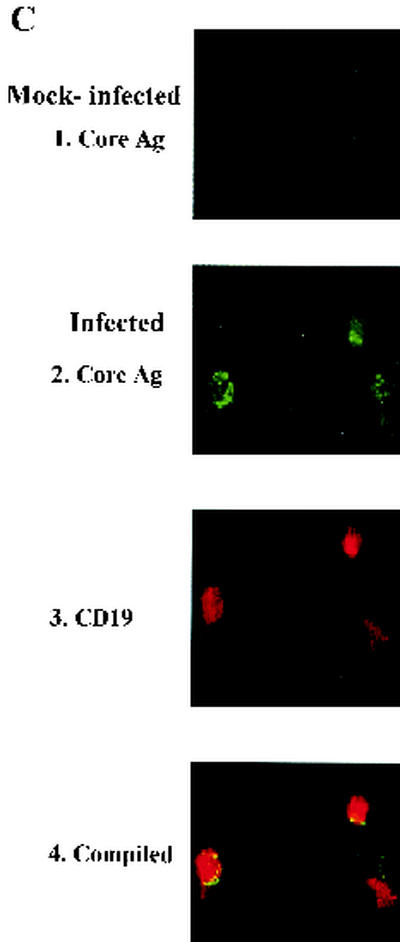
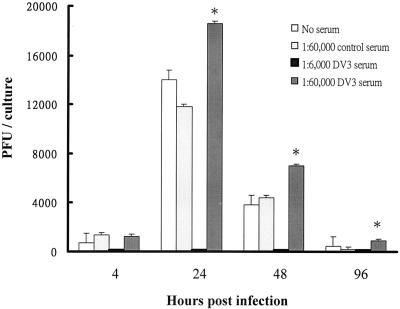
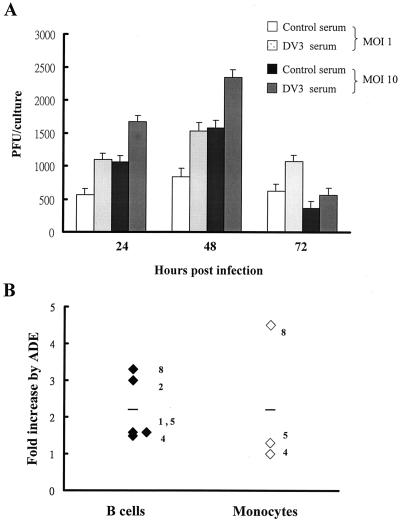
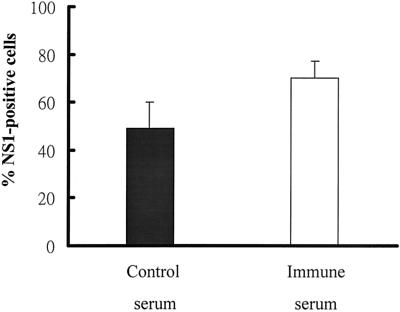
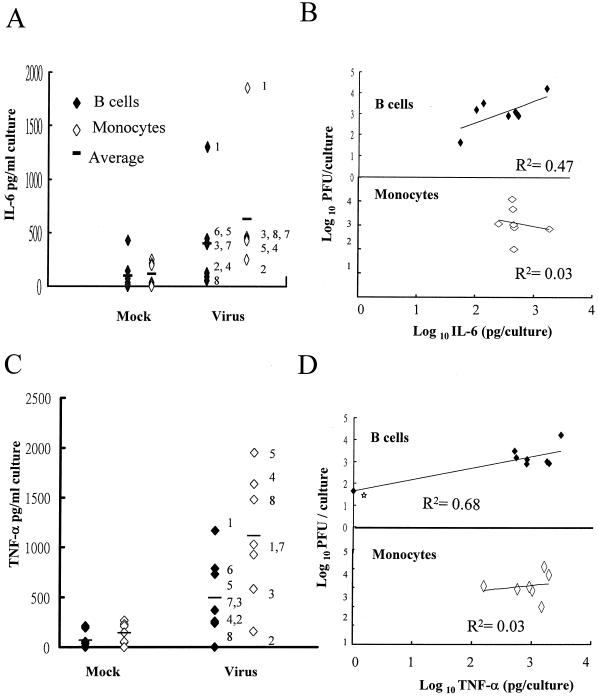
Dengue virus (DV) replication, antibody-enhanced viral infection, and cytokine responses of human primary B lymphocytes (cells) were characterized and compared with those of monocytes. The presence of a replication template (negative-strand RNA intermediate), viral antigens including core and nonstructural proteins, and increasing amounts of virus with time postinfection indicated that DV actively replicated in B cells. Virus infection also induced B cells to produce interleukin-6 and tumor necrosis factor alpha, which have been previously implicated in virus pathogenesis. In addition, a heterologous antibody was able to enhance both virus and cytokine production in B cells. Furthermore, the levels of virus replication, antibody-enhanced virus replication, and cytokine responses observed in B cells were not statistically different from those in monocytes. These results suggest that B cells may play an important role in DV pathogenesis.
Figures
Similar articles
-
Monocytes, but not T or B cells, are the principal target cells for dengue virus (DV) infection among human peripheral blood mononuclear cells.J Med Virol. 2008 Jan;80(1):134-46. doi: 10.1002/jmv.21051. J Med Virol. 2008. PMID: 18041019
-
Human T Lymphocytes Are Permissive for Dengue Virus Replication.J Virol. 2018 Apr 27;92(10):e02181-17. doi: 10.1128/JVI.02181-17. Print 2018 May 15. J Virol. 2018. PMID: 29514900 Free PMC article.
-
Infection of human dendritic cells by dengue virus causes cell maturation and cytokine production.J Immunol. 2001 Feb 1;166(3):1499-506. doi: 10.4049/jimmunol.166.3.1499. J Immunol. 2001. PMID: 11160189
-
Role of Monocytes in the Pathogenesis of Dengue.Arch Immunol Ther Exp (Warsz). 2019 Feb;67(1):27-40. doi: 10.1007/s00005-018-0525-7. Epub 2018 Sep 20. Arch Immunol Ther Exp (Warsz). 2019. PMID: 30238127 Review.
-
Mechanisms of monocyte cell death triggered by dengue virus infection.Apoptosis. 2018 Dec;23(11-12):576-586. doi: 10.1007/s10495-018-1488-1. Apoptosis. 2018. PMID: 30267240 Review.
Cited by
-
The development, optimization and validation of an assay for high throughput antiviral drug screening against Dengue virus.Int J Clin Exp Med. 2009 Dec 8;2(4):363-73. Int J Clin Exp Med. 2009. PMID: 20057980 Free PMC article.
-
Nonalcoholic fatty liver disease is associated with increased hemoconcentration, thrombocytopenia, and longer hospital stay in dengue-infected patients with plasma leakage.PLoS One. 2018 Oct 17;13(10):e0205965. doi: 10.1371/journal.pone.0205965. eCollection 2018. PLoS One. 2018. PMID: 30332476 Free PMC article.
-
A molecular evaluation of dengue virus pathogenesis and its latest vaccine strategies.Mol Biol Rep. 2011 Aug;38(6):3731-40. doi: 10.1007/s11033-010-0488-1. Epub 2010 Nov 24. Mol Biol Rep. 2011. PMID: 21107723 Review.
-
Elucidating the role of T cells in protection against and pathogenesis of dengue virus infections.Future Microbiol. 2014;9(3):411-25. doi: 10.2217/fmb.13.171. Future Microbiol. 2014. PMID: 24762312 Free PMC article. Review.
-
Antibody-independent functions of B cells during viral infections.PLoS Pathog. 2021 Jul 22;17(7):e1009708. doi: 10.1371/journal.ppat.1009708. eCollection 2021 Jul. PLoS Pathog. 2021. PMID: 34293057 Free PMC article. Review.
References
-
- Bethell, D. B., K. Flobbe, X. T. Cao, N. P. Day, T. P. Pham, W. A. Buurman, M. J. Cardosa, N. J. White, and D. Kwiatkowski. 1998. Pathological and progonostic role of cytokines in dengue hemorrhagic fever. J. Infect. Dis. 177:778-782. - PubMed
Publication types
MeSH terms
Substances
LinkOut - more resources
Full Text Sources
