Retroelement distributions in the human genome: variations associated with age and proximity to genes
- PMID: 12368240
- PMCID: PMC187529
- DOI: 10.1101/gr.388902
Retroelement distributions in the human genome: variations associated with age and proximity to genes
Abstract
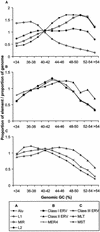
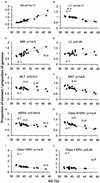
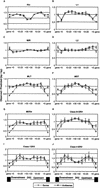
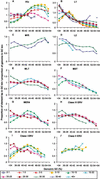
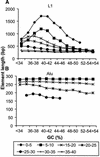
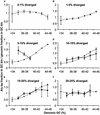
Remnants of more than 3 million transposable elements, primarily retroelements, comprise nearly half of the human genome and have generated much speculation concerning their evolutionary significance. We have exploited the draft human genome sequence to examine the distributions of retroelements on a genome-wide scale. Here we show that genomic densities of 10 major classes of human retroelements are distributed differently with respect to surrounding GC content and also show that the oldest elements are preferentially found in regions of lower GC compared with their younger relatives. In addition, we determined whether retroelement densities with respect to genes could be accurately predicted based on surrounding GC content or if genes exert independent effects on the density distributions. This analysis revealed that all classes of long terminal repeat (LTR) retroelements and L1 elements, particularly those in the same orientation as the nearest gene, are significantly underrepresented within genes and older LTR elements are also underrepresented in regions within 5 kb of genes. Thus, LTR elements have been excluded from gene regions, likely because of their potential to affect gene transcription. In contrast, the density of Alu sequences in the proximity of genes is significantly greater than that predicted based on the surrounding GC content. Furthermore, we show that the previously described density shift of Alu repeats with age to domains of higher GC was markedly delayed on the Y chromosome, suggesting that recombination between chromosome pairs greatly facilitates genomic redistributions of retroelements. These findings suggest that retroelements can be removed from the genome, possibly through recombination resulting in re-creation of insert-free alleles. Such a process may provide an explanation for the shifting distributions of retroelements with time.
Figures
Similar articles
-
The (r)evolution of SINE versus LINE distributions in primate genomes: sex chromosomes are important.Genome Res. 2010 May;20(5):600-13. doi: 10.1101/gr.099044.109. Epub 2010 Mar 10. Genome Res. 2010. PMID: 20219940 Free PMC article.
-
The distribution of L1 and Alu retroelements in relation to GC content on human sex chromosomes is consistent with the ectopic recombination model.J Mol Evol. 2006 Oct;63(4):484-92. doi: 10.1007/s00239-005-0275-0. Epub 2006 Sep 4. J Mol Evol. 2006. PMID: 16955238
-
Alu and L1 retroelements are correlated with the tissue extent and peak rate of gene expression, respectively.J Korean Med Sci. 2004 Dec;19(6):783-92. doi: 10.3346/jkms.2004.19.6.783. J Korean Med Sci. 2004. PMID: 15608386 Free PMC article.
-
[Alu repeats in the human genome].Mol Biol (Mosk). 2003 May-Jun;37(3):382-91. Mol Biol (Mosk). 2003. PMID: 12815945 Review. Russian.
-
Gene-containing regions of wheat and the other grass genomes.Plant Physiol. 2002 Mar;128(3):803-11. doi: 10.1104/pp.010745. Plant Physiol. 2002. PMID: 11891237 Free PMC article. Review.
Cited by
-
Endogenous feline leukemia virus long terminal repeat integration site diversity is highly variable in related and unrelated domestic cats.Retrovirology. 2024 Feb 12;21(1):3. doi: 10.1186/s12977-024-00635-0. Retrovirology. 2024. PMID: 38347535 Free PMC article.
-
Recent insights into crosstalk between genetic parasites and their host genome.Brief Funct Genomics. 2024 Jan 18;23(1):15-23. doi: 10.1093/bfgp/elac032. Brief Funct Genomics. 2024. PMID: 36307128 Free PMC article. Review.
-
Multiple effects govern endogenous retrovirus survival patterns in human gene introns.Genome Biol. 2006;7(9):R86. doi: 10.1186/gb-2006-7-9-r86. Genome Biol. 2006. PMID: 17005047 Free PMC article.
-
Characterization of pre-insertion loci of de novo L1 insertions.Gene. 2007 Apr 1;390(1-2):190-8. doi: 10.1016/j.gene.2006.08.024. Epub 2006 Sep 12. Gene. 2007. PMID: 17067767 Free PMC article.
-
Genomic heterogeneity of background substitutional patterns in Drosophila melanogaster.Genetics. 2005 Feb;169(2):709-22. doi: 10.1534/genetics.104.032250. Epub 2004 Nov 1. Genetics. 2005. PMID: 15520267 Free PMC article.
References
-
- Batzer MA, Deininger PL. Alu repeats and human genomic diversity. Nat Rev Genet. 2002;3:370–379. - PubMed
-
- Britten RJ. Mobile elements inserted in the distant past have taken on important functions. Gene. 1997;205:177–182. - PubMed
-
- Brookfield JF. Selection on Alu sequences? Curr Biol. 2001;11:R900–R901. - PubMed
-
- Brosius J. Genomes were forged by massive bombardments with retroelements and retrosequences. Genetica. 1999;107:209–238. - PubMed
Publication types
MeSH terms
Substances
LinkOut - more resources
Full Text Sources
Other Literature Sources
Medical
Miscellaneous
