

Regulation of murine airway surface liquid volume by CFTR and Ca2+-activated Cl- conductances
- PMID: 12198094
- PMCID: PMC2229523
- DOI: 10.1085/jgp.20028599
Regulation of murine airway surface liquid volume by CFTR and Ca2+-activated Cl- conductances
Abstract
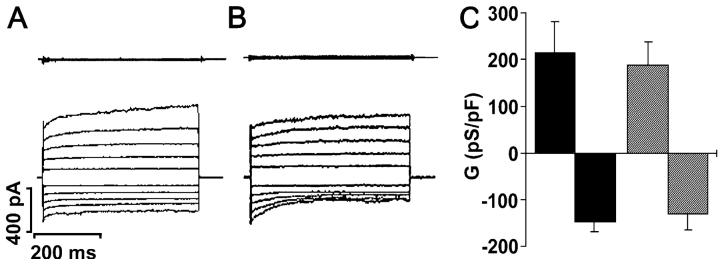
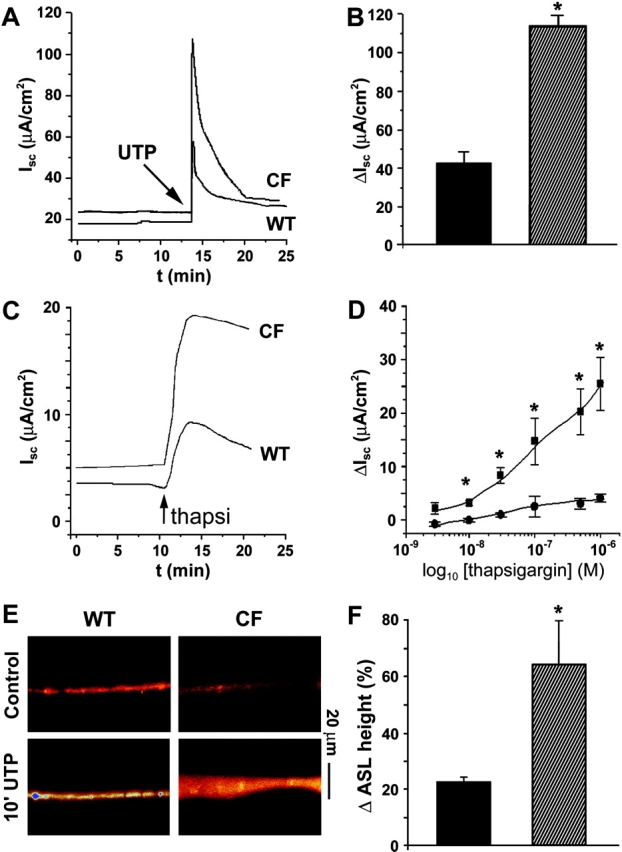
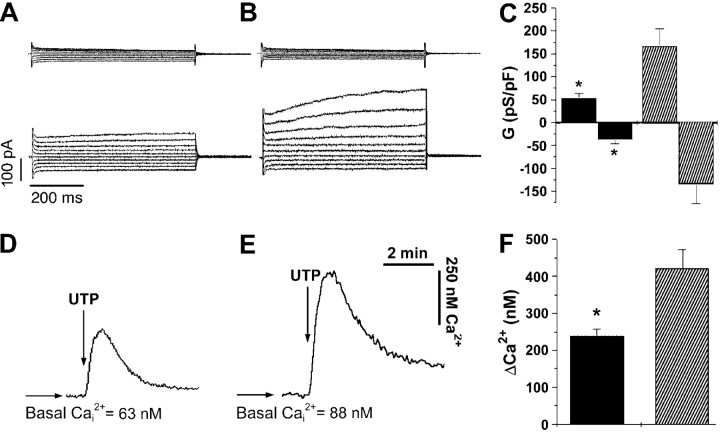
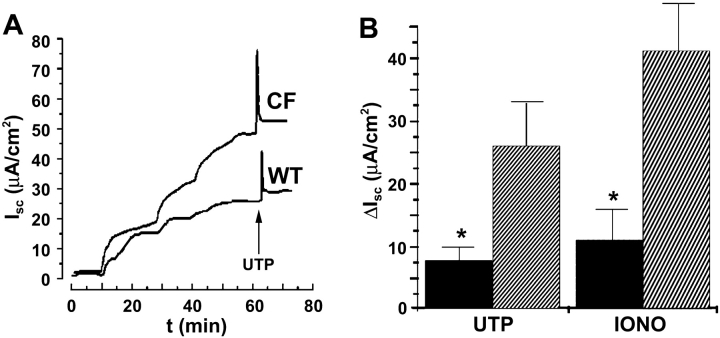
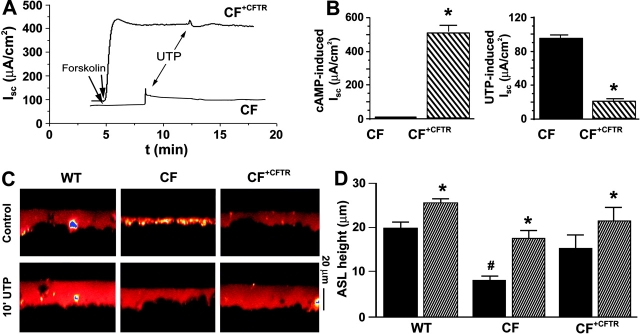
Two Cl(-) conductances have been described in the apical membrane of both human and murine proximal airway epithelia that are thought to play predominant roles in airway hydration: (1) CFTR, which is cAMP regulated and (2) the Ca(2+)-activated Cl(-) conductance (CaCC) whose molecular identity is uncertain. In addition to second messenger regulation, cross talk between these two channels may also exist and, whereas CFTR is absent or defective in cystic fibrosis (CF) airways, CaCC is preserved, and may even be up-regulated. Increased CaCC activity in CF airways is controversial. Hence, we have investigated the effects of CFTR on CaCC activity and have also assessed the relative contributions of these two conductances to airway surface liquid (ASL) height (volume) in murine tracheal epithelia. We find that CaCC is up-regulated in intact murine CF tracheal epithelia, which leads to an increase in UTP-mediated Cl(-)/volume secretion. This up-regulation is dependent on cell polarity and is lost in nonpolarized epithelia. We find no role for an increased electrical driving force in CaCC up-regulation but do find an increased Ca(2+) signal in response to mucosal nucleotides that may contribute to the increased Cl(-)/volume secretion seen in intact epithelia. CFTR plays a critical role in maintaining ASL height under basal conditions and accordingly, ASL height is reduced in CF epithelia. In contrast, CaCC does not appear to significantly affect basal ASL height, but does appear to be important in regulating ASL height in response to released agonists (e.g., mucosal nucleotides). We conclude that both CaCC and the Ca(2+) signal are increased in CF airway epithelia, and that they contribute to acute but not basal regulation of ASL height.
Figures

Similar articles
-
The cystic fibrosis transmembrane conductance regulator attenuates the endogenous Ca2+ activated Cl- conductance of Xenopus oocytes.Pflugers Arch. 1997 Dec;435(1):178-81. doi: 10.1007/s004240050498. Pflugers Arch. 1997. PMID: 9359918
-
Modulation of Ca2+-activated Cl- secretion by basolateral K+ channels in human normal and cystic fibrosis airway epithelia.Pediatr Res. 2003 Apr;53(4):608-18. doi: 10.1203/01.PDR.0000057204.51420.DC. Epub 2003 Feb 5. Pediatr Res. 2003. PMID: 12612194
-
Lipoxin A4 stimulates calcium-activated chloride currents and increases airway surface liquid height in normal and cystic fibrosis airway epithelia.PLoS One. 2012;7(5):e37746. doi: 10.1371/journal.pone.0037746. Epub 2012 May 25. PLoS One. 2012. PMID: 22662206 Free PMC article.
-
Regulation of normal and cystic fibrosis airway surface liquid volume by phasic shear stress.Annu Rev Physiol. 2006;68:543-61. doi: 10.1146/annurev.physiol.68.072304.112754. Annu Rev Physiol. 2006. PMID: 16460283 Review.
-
Adenosine receptors, cystic fibrosis, and airway hydration.Handb Exp Pharmacol. 2009;(193):363-81. doi: 10.1007/978-3-540-89615-9_12. Handb Exp Pharmacol. 2009. PMID: 19639288 Review.
Cited by
-
Therapeutic Approaches to Acquired Cystic Fibrosis Transmembrane Conductance Regulator Dysfunction in Chronic Bronchitis.Ann Am Thorac Soc. 2016 Apr;13 Suppl 2(Suppl 2):S169-76. doi: 10.1513/AnnalsATS.201509-601KV. Ann Am Thorac Soc. 2016. PMID: 27115953 Free PMC article. Review.
-
INO-4995 therapeutic efficacy is enhanced with repeat dosing in cystic fibrosis knockout mice and human epithelia.Am J Respir Cell Mol Biol. 2010 Jan;42(1):105-12. doi: 10.1165/rcmb.2008-0380OC. Epub 2009 Apr 3. Am J Respir Cell Mol Biol. 2010. PMID: 19346319 Free PMC article.
-
Concurrent absorption and secretion of airway surface liquids and bicarbonate secretion in human bronchioles.Am J Physiol Lung Cell Mol Physiol. 2019 May 1;316(5):L953-L960. doi: 10.1152/ajplung.00545.2018. Epub 2019 Mar 6. Am J Physiol Lung Cell Mol Physiol. 2019. PMID: 30838869 Free PMC article.
-
Lung Microbiome in Cystic Fibrosis.Life (Basel). 2021 Jan 27;11(2):94. doi: 10.3390/life11020094. Life (Basel). 2021. PMID: 33513903 Free PMC article. Review.
-
Role of CFTR in epithelial physiology.Cell Mol Life Sci. 2017 Jan;74(1):93-115. doi: 10.1007/s00018-016-2391-y. Epub 2016 Oct 6. Cell Mol Life Sci. 2017. PMID: 27714410 Free PMC article. Review.
References
-
- Boucher, R.C. 1994. Human airway ion transport. Am. J. Respir. Crit. Care Med. 150:271–281. - PubMed
-
- Devor, D.C., R.J. Bridges, and J.M. Pilewski. 2000. Pharmacological modulation of ion transport across wild-type and DeltaF508 CFTR-expressing human bronchial epithelia. Am. J. Physiol. 279:461–479. - PubMed
Publication types
MeSH terms
Substances
Grants and funding
LinkOut - more resources
Full Text Sources
Other Literature Sources
Miscellaneous
